Semua tulisan dari Ahmad Sobirin

Tutorial Trading, 12 Popular Candlestick Patterns Used in Technical Analysis

Tutorial Trading, 12 Popular Candlestick Patterns Used in Technical Analysis


Introduction

Candlestick charts are one of the most commonly used technical tools to analyze price patterns. They have been used by traders and investors for centuries to find patterns that may indicate where the price is headed. This article will cover some of the most well-known candlestick patterns with illustrated examples.
If you’d first like to get familiar with reading candlestick charts, check out A Beginner’s Guide to Candlestick Charts.

How to use candlestick patterns

There are countless candlestick patterns that traders can use to identify areas of interest on a chart. These can be used for day trading, swing trading, and even longer-term position trading. While some candlestick patterns may provide insights into the balance between buyers and sellers, others may indicate a reversal, continuation, or indecision.
It’s important to note that candlestick patterns aren’t necessarily a buy or sell signal by themselves. They are instead a way to look at market structure and a potential indication of an upcoming opportunity. As such, it is always useful to look at patterns in context. This can be the context of the technical pattern on the chart, but also the broader market environment and other factors.
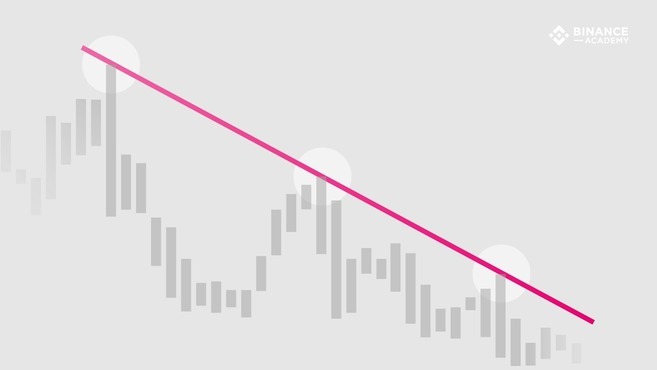
In short, like any other market analysis tool, candlestick patterns are most useful when used in combination with other techniques. These may include the Wyckoff Method, the Elliott Wave Theory and the Dow Theory. It can also include technical analysis (TA) indicators, such as Trend LinesMoving Averages, the Relative Strength Index (RSI)Stochastic RSIBollinger BandsIchimoku CloudsParabolic SAR, or the MACD.

Bullish reversal patterns

Hammer 

A candlestick with a long lower wick at the bottom of a downtrend, where the lower wick is at least twice the size of the body.
A hammer shows that even though the selling pressure was high, the bulls drove the price back up close to the open. A hammer can be either red or green, but green hammers may indicate a stronger bull reaction.

Bullish reversal candlestick pattern - Hammer

Inverted hammer

Also called the inverse hammer, it’s just like a hammer, but with a long wick above the body rather than below. Similar to a hammer, the upper wick should be at least twice the size of the body. 
An inverted hammer occurs at the bottom of a downtrend and may indicate a potential reversal upward. The upper wick shows that price stopped its continued downward movement, even though the sellers eventually managed to drive it down near the open. As such, the inverted hammer may suggest that buyers soon might gain control of the market. 

Bullish reversal candlestick pattern - inverted hammer

Three white soldiers

The three white soldiers pattern consists of three consecutive green candlesticks that all open within the previous candle’s body, and close at a level exceeding the previous candle’s high. 
Ideally, these candlesticks shouldn’t have long lower wicks, indicating that continuous buying pressure is driving the price up. The size of the candles and the length of the wicks can be used to judge the chances of continuation or a possible retracement.

Bullish reversal candlestick pattern - Three white soldiers

Bullish harami

A bullish harami is a long red candle followed by a smaller green candle that’s entirely contained within the body of the previous candle.
The bullish harami can unfold over two or more days, and it’s a pattern indicating that selling momentum is slowing down and might be coming to an end.

Bullish reversal candlestick pattern - Bullish Harami


Bearish reversal patterns

Hanging man

The hanging man is the bearish equivalent of a hammer. It typically forms at the end of an uptrend with a small body and a long lower wick. 
The lower wick indicates that there was a large sell-off, but bulls managed to take back control and drive the price up. Keeping that in mind, after a prolonged uptrend, the sell-off may act as a warning that the bulls might soon be losing control of the market.

Bearish reversal candlestick pattern - Hanging man

Shooting star

The shooting star is made of a candlestick with a long upper wick, little or no lower wick, and a small body, ideally near the low. The shooting star is a similar shape as the inverted hammer but is formed at the end of an uptrend.
It indicates that the market reached a high, but then sellers took control and drove the price back down. Some traders prefer to wait for the next few candlesticks to unfold for confirmation of the pattern.

Bearish reversal candlestick pattern - Shooting Star

Three black crows

The three black crows are made of three consecutive red candlesticks that open within the previous candle’s body, and close at a level below the previous candle’s low.
The bearish equivalent of three white soldiers. Ideally, these candlesticks shouldn’t have long higher wicks, indicating continuous selling pressure driving the price down. The size of the candles and the length of the wicks can be used to judge the chances of continuation.

Bearish reversal candlestick pattern - Three black crows

Bearish harami

The bearish harami is a long green candle followed by a small red candle with a body that’s entirely contained within the body of the previous candle.
The bearish harami can unfold over two or more days, appears at the end of a downtrend, and may indicate that buying pressure is decreasing.

Bearish reversal candlestick pattern - Bearish Harami

Dark cloud cover

The dark cloud cover pattern consists of a red candle that opens above the close of the previous green candle but then closes below the midpoint of that candle.
It can often be accompanied by high volume, indicating that momentum might be shifting from the upside to the downside. Traders might wait for a third red candle for confirmation of the pattern.

Bearish reversal candlestick pattern - Dark Could Cover

Continuation patterns

Rising three methods

This pattern occurs in an uptrend, where three consecutive red candles with small bodies are followed by the continuation of the uptrend. Ideally, the red candles shouldn’t breach the range of the preceding candlestick. 
The continuation is confirmed with a green candle with a large body, indicating that bulls are back in control of the trend’s direction.

continuation candlestick pattern - Rising three methods

Falling three methods

The inverse of rising three methods, indicating the continuation of a downtrend instead.

continuation candlestick pattern - Falling three methods

Doji

A Doji forms when the open and the close are the same (or very close to each other). The price can move above and below the open but eventually closes at or near the open. As such, a Doji may indicate an indecision point between buying and selling forces. Still, the interpretation of a Doji is highly dependent on context.
Depending on where the line of the open/close falls, a Doji can be described as:

Gravestone Doji – Bearish reversal candle with a long upper wick and the open/close near the low. 

Doji candlestick pattern - Gravestone Doji

Long-legged Doji – Indecisive candle with both a lower and upper wick, and the open/close near the midpoint.

Doji candlestick pattern - Long Legged Doji

Dragonfly Doji – Either bullish or bearish candle (depending on context) with a long lower wick and the open/close near the high.

Doji candlestick pattern - Dragonfly Doji

According to the original definition of the Doji, the open and close should be exactly the same. But, what if the open and close aren’t the same but are instead very close to each other? That’s called a spinning top. However, since cryptocurrency markets can be very volatile, an exact Doji is rare. As such, the spinning top is often used interchangeably with the Doji.

Candlestick patterns based on price gaps

There are many candlestick patterns that use price gaps. A price gap is formed when a financial asset opens above or below its previous closing price, which creates a gap between the two candlesticks. Since cryptocurrency markets trade round the clock, patterns based on these types of price gaps are not present. Even so, price gaps can still occur in illiquid markets. However, since they happen mainly because of low liquidity and high bid-ask spreads, they might not be useful as actionable patterns.

Closing thoughts

Candlestick patterns are essential for any trader to at least be familiar with, even if they don’t directly incorporate them into their trading strategy.
While they can be undoubtedly useful to analyze the markets, it’s important to remember that they aren’t based on any scientific principles or laws. They instead convey and visualize the buying and selling forces that ultimately drive the markets.

Tutorials Trading, What is Elliott Wave?

What is Elliott Wave?

The Elliott Wave refers to a theory (or principle) that investors and traders may adopt in technical analysis. The principle is based on the idea that financial markets tend to follow specific patterns, regardless of the timeframe.
Essentially, the Elliott Wave Theory (EWT) suggests that market movements follow a natural sequence of crowd psychology cycles. Patterns are created according to current market sentiment, which alternates between bearish and bullish.
An Introduction to the Elliott Wave Theory
The Elliott Wave principle was created in the ’30s by Ralph Nelson Elliott – an American accountant and author. However, the theory only rose in popularity in the ’70s, thanks to the efforts of Robert R. Prechter and A. J. Frost.
Initially, the EWT was called the Wave Principle, which is a description of human behavior. Elliott’s creation was based on his extensive study of market data, with a focus on stock markets. His systematic research included at least 75 years’ worth of information.
As a technical analysis tool, the EWT is now used in an attempt to identify market cycles and trends, and it can be applied across a range of financial markets. However, the Elliott Wave is not an indicator or trading technique. Instead, it is a theory that may help to predict market behavior. As Prechter states in his book: 
[…] the Wave Principle is not primarily a forecasting tool; it is a detailed description of how markets behave.
– Prechter, R. R. The Elliott Wave Principle (p.19).

The basic Elliott Wave pattern

Typically, the basic Elliott Wave pattern is identifiable by an eight-wave pattern, which contains five Motive Waves (that move in favor of the major trend), and three Corrective Waves (that move in the opposite direction).
So, a complete Elliott Wave cycle in a bullish market would look like this:
an introduction to the elliott wave theory

Note that, in the first example, we have five Motive Waves: three in the upward move (1, 3, and 5), plus two in the downward move (A and C). Simply put, any move that is in accordance with the major trend may be considered a Motive Wave. This means that 2, 4, and B are the three Corrective Waves.
But according to Elliott, financial markets create patterns of a fractal nature. So, if we zoom out to longer timeframes, the movement from 1 to 5 can also be considered a single Motive Wave (i), while the A-B-C move may represent a single Corrective Wave (ii).
an introduction to the elliott wave theory

Also, if we zoom in to lower timeframes, a single Motive Wave (such as 3) can be further divided into five smaller waves, as illustrated in the next section.
In contrast, an Elliott Wave cycle in a bearish market would look like this:
an introduction to the elliott wave theory


Motive Waves

As defined by Prechter, Motive Waves always move in the same direction as the bigger trend.
As we’ve just seen, Elliott described two types of wave development: Motive and Corrective Waves. The previous example involved five Motive and three Corrective Waves. But, if we zoom in to a single Motive Wave, it will consist of a smaller five-wave structure. Elliott called it the Five-Wave Pattern, and he created three rules to describe its formation:
  • Wave 2 can’t retrace more than 100% of the preceding wave 1 move.
  • Wave 4 can’t retrace more than 100% of the preceding wave 3 move.
  • Among waves 1, 3, and 5, wave 3 can’t be the shortest, and is often the longest one. Also, Wave 3 always moves past the end of Wave 1.

an introduction to the elliott wave theory

Corrective Waves

Unlike Motive Waves, Corrective Waves are typically made of a three-wave structure. They are often formed by a smaller Corrective Wave occurring between two smaller Motive Waves. The three waves are often named A, B, and C.
an introduction to the elliott wave theory

When compared to Motive Waves, Corrective Waves tend to be smaller because they move against the bigger trend. In some cases, such a counter-trend struggle can also make Corrective Waves much harder to identify as they can vary significantly in length and complexity.
According to Prechter, the most important rule to keep in mind regarding Corrective Waves is that they are never made of five waves.

Does Elliott Wave work?

There is an ongoing debate regarding the efficiency of the Elliott waves. Some say that the success rate of the Elliott Wave principle is heavily dependent on the traders’ ability to precisely divide the market movements into trends and corrections. 
In practice, the waves may be drawn in several ways, without necessarily breaking Elliot’s rules. This means that drawing the waves correctly is far from a simple task. Not only because it requires practice, but also due to the high level of subjectivity involved.
Accordingly, critics argue that the Elliott Wave Theory isn’t a legitimate theory due to its highly subjective nature, and relies on a loosely defined set of rules. Still, there are thousands of successful investors and traders that have managed to apply Elliott’s principles in a profitable manner.
Interestingly, there is a growing number of traders combining the Elliott Wave Theory with technical indicators to increase their success rate and reduce risks. The Fibonacci Retracement and the Fibonacci Extension indicators are perhaps the most popular examples.

Closing thoughts

According to Prechter, Elliott never really speculated on why markets tend to present a 5-3 wave structure. Instead, he simply analyzed the market data and came to this conclusion. Elliott’s principle is simply a result of the inevitable market cycles created by human nature and crowd psychology.
As mentioned, however, the Elliott Wave is not a TA indicator, but a theory. As such, there is no right way to use it, and it is inherently subjective. Accurately predicting market moves with the EWT requires practice and skills because traders need to figure out how to draw the wave counts. This means that its use can be risky – especially for beginners.

Trading Tutorials, What is the Parabolic SAR?

What is the Parabolic SAR?

Technical analyst J. Welles Wilder Jr. developed the Parabolic Stop and Reverse (SAR) indicator in the late 1970s. It was presented in his book New Concepts in Technical Trading Systems, along with other popular indicators, such as the Relative Strength Index (RSI).
In fact, Wilder called this approach the Parabolic Time/Price System, while the concept of SAR was presented as follows:
SAR stands for Stop and Reverse. This is the point at which a Long trade is exited and a Short trade is entered, or vice versa.
– Wilder, J. W., Jr. (1978). New Concepts in Technical Trading Systems (p. 8).
A Brief Guide to the Parabolic SAR Indicator
Today, the system is commonly referred to as the Parabolic SAR indicator, which is used as a tool for identifying market trends and potential points of reversal. Although Wilder developed numerous technical analysis (TA) indicators manually, they are now part of most digital trading systems and charting software. As such, the techniques no longer require manual calculations and are relatively simple to use.

How does it work?

The Parabolic SAR indicator consists of small dots that are placed either above or below the market price. The disposal of the dots creates a parabola, but each dot represents a single SAR value.
In short, the dots are plotted below the price during an uptrend, and above it during a downtrend. They are also plotted during periods of consolidation, where the market moves sideways. But in this case, the dots will change from one side to another much more frequently. In other words, the Parabolic SAR indicator is less useful during non-trending markets.

Benefits

The Parabolic SAR can provide insights into the direction and duration of market trends, as well as potential points of reversal. As such, it may increase the chances of investors finding good buying and selling opportunities.
Some traders also use the Parabolic SAR indicator to determine dynamic stop-loss prices, so that their stops move along with the market trend. Such a technique is often referred to as trailing stop-loss. 
Essentially, it allows traders to lock profits that were already made because their positions are closed as soon as the trend reverses. In some situations, it may also prevent traders from closing profitable positions or entering a trade too early.

Limitations

As mentioned, the Parabolic SAR is particularly useful in trending markets, but not so much during periods of consolidation. When there is a lack of a clear trend, the indicator is more likely to provide false signals, which may cause significant losses.
A choppy market (that moves up and down too quick) may also provide numerous misleading signals. So, the Parabolic SAR indicator tends to work best when prices change at a more gradual pace.
Another thing to consider is the sensitivity of the indicator, which can be adjusted manually. The higher the sensitivity, the higher the chances of false signals occurring.
In some cases, false signals can encourage traders to close winning positions too early, selling assets that still have earning potential. Even worse, fake breakouts can give investors a false sense of optimism, inducing them into buying too soon.
Lastly, because the indicator doesn’t consider the trading volume, it doesn’t give much information about the strength of a trend. Although big market movements cause the gap between each dot to widen, that should not be taken as indicative of a strong trend.
No matter how much information traders and investors have, risks will always be part of financial markets. But, many of them combine the Parabolic SAR with other strategies or indicators as a way to minimize risks and offset limitations. 
Wilder recommended using the Average Directional Index along with the Parabolic SAR to gauge the strength of trends. In addition, moving averages, or the RSI indicator can also be included in the analysis before entering a position.

The Parabolic SAR calculation

Today, computer programs perform the calculations automatically. But for the ones interested, this section gives a brief explanation of the Parabolic SAR calculation.
The SAR points are calculated based on existing market data. So, to calculate today’s SAR, we use yesterday’s SAR, and to calculate tomorrow’s value, we use today’s SAR.
During an uptrend, the SAR value is calculated based on the previous highs. During downtrends, the previous lows are considered instead. Wilder referred to the highest and lowest points in a trend as Extreme Points (EP). However, the equation is not the same for uptrends and downtrends.
For uptrends:
SAR = Prior SAR + AF x (Prior EP – Prior SAR)
For downtrends:
SAR = Prior SAR – AF x  (Prior SAR – Prior EP)
AF stands for the acceleration factor. It starts at 0.02 and increases by 0.02 whenever the price makes a new high (for uptrends) or a new low (for downtrends). However, if the limit of 0.20 is reached, this value is maintained by the duration of that trade (until the trend reverses).
In practice, some chartists manually adjust the AF to change the indicator’s sensitivity. An AF higher than 0.2 will result in increased sensitive (more reversal signals). An AF lower than 0.2  does the opposite. Still, Wilder stated in his book that 0.02 increases worked best overall.
While the calculation is relatively simple to use, some traders asked Wilder how to calculate the first SAR, considering that the equation requires the previous values. According to him, the first SAR can be calculated based on the last EP before a market trend reversal.
Wilder recommended traders to go back in their chart to find a clear reversal, and then use that EP as the first SAR value. The following SAR could then be calculated until the last market prices are reached. 
For instance, if the market is trending up, a trader could go back a couple of days or weeks until they find a previous correction. Next, they find the local bottom (EP) for that correction, which could then be used as the first SAR for the following uptrend.

Closing Thoughts

Although it dates back to the 1970s, the Parabolic SAR is still widely used today. Investors can apply it to many of today’s investment alternatives, including Forex, commodities, stock, and cryptocurrency markets. 
But no market analytics tool can guarantee 100% accuracy. So, before using Parabolic SAR or any other strategy, investors should make sure they have a good understanding of financial markets and technical analysis. They should also have proper trading and risk management strategies to mitigate the inevitable risks.

Trading Tutorial, What are trend lines?

What are trend lines?

In financial markets, trend lines are diagonal lines drawn on charts. They connect specific data points, making it easier for chartists and traders to visualize price movements and identify market trends. 
Trend lines are considered one of the most basic tools in technical analysis (TA). They are widely used in stock, fiat currency, derivatives, and cryptocurrency markets. 
Essentially, trend lines work like support and resistance levels but are made of diagonals instead of horizontal lines. As such, they can have either a positive or negative slope. In general, the greater the slope of the line, the stronger the trend is.
We can divide trend lines into two basic categories: ascending (uptrend) and descending (downtrend). As the name suggests, an uptrend line is drawn from a lower to a higher chart position. It connects two or more low points, as illustrated in the image below.

Trend Lines Explained

In contrast, a downtrend line is drawn from a higher to a lower position in the chart. It connects two or more high points.

Trend Lines Explained

So, the difference between the two types of lines is the selection of the points that are used to draw them. In an uptrend, the lines will be drawn using the lowest points in the chart (i.e., candlestick bottoms forming higher lows). On the other hand, downtrend lines are drawn using the highest values (i.e., candlestick tops forming lower highs).

How to use trend lines

Based on the highs and lows of a chart, trend lines indicate where the price briefly challenged the prevailing trend, tested it, and then turned back in its favor. The line can then be extended to try and predict important levels in the future. The trend line may be tested several times, but as long as it isn’t broken, it is considered valid.
While trend lines can be used in all kinds of data charts, they are usually applied to financial charts (based on market prices). They provide insights into the market supply and demand. Naturally, upward trend lines indicate an increasing buying force (demand is higher than supply). Downward trend lines are associated with consistent price drops, suggesting the opposite (supply is higher than demand).
However, the trading volume should also be considered in such analyses. For instance, if the price is increasing, but the volume is decreasing or is relatively low, it may give a false impression of increased demand.
As mentioned, trend lines are used to identify support and resistance levels, which are two basic but very important concepts of technical analysis. An uptrend line shows support levels below which the price is unlikely to drop. In contrast, the downtrend line highlights resistance levels above which the price is unlikely to rise.
In other words, the market trend may be considered invalid when the support and resistance levels are broken, either to the downside (for an uptrend line) or to the upside (for a downtrend line). In many cases, when these key levels fail to hold the trend, the market tends to change direction.
Still, technical analysis is a subjective field, and each person may present a completely different method for drawing trend lines. Thus, it may be worth combining multiple TA techniques, as well as fundamental analysis to reduce risks.

Drawing valid trend lines

Technically, trend lines can connect any two points in a chart. But, most chartists agree that using three points or more is what makes a trend line valid. In some cases, the first two points can be used to define a trend in potential, and the third point (extended in the future) can be used to test its validity.
So, when the price touches the trend line three or more times without breaching it, the trend can be considered valid. Testing the trend line multiple times indicates that maybe the trend is not a mere coincidence caused by price fluctuations.

Scale settings

In addition to choosing enough points to create a valid trend line, it’s important to consider proper settings when drawing them. Among the most important chart settings is the scale settings.
In financial charts, the scale relates to the manner in which the change in price is displayed. The two most popular scales are arithmetic and semi-logarithmic (semi-log). On an arithmetic chart, change is expressed evenly as the price moves up or down the Y-axis. In contrast, semi-log charts express variations in terms of percentage. 
For example, a price change from $5 to $10 would cover the same distance on an arithmetic chart as one from $120 to $125. On a semi-log chart, however, the 100% gain ($5 to $10) would occupy a much larger portion of the chart, as opposed to the 4% increase of the $120 to $125  move.
It’s important to consider the scale settings when drawing trend lines. Each type of chart may result in different highs and lows and, thus, slightly different trend lines.

Closing thoughts

While they are useful tools for technical analysis, trend lines are far from foolproof. The choice of points used to draw trend lines will affect the degree to which they accurately represent market cycles and real trends, making them somewhat subjective. 
For instance, some chartists draw trend lines based on the body of the candlesticks, disregarding the wicks. Others prefer to draw lines according to the highs and lows of the wicks. 
So, it’s important to use trend lines in conjunction with other charting tools and indicators. Notable examples of other TA indicators include the Ichimoku CloudsBollinger Bands (BB)MACDStochastic RSIRSI, and moving averages.

Guid Tutorial Trading, What are leading and lagging indicators?

What are leading and lagging indicators?


Leading and lagging indicators are tools that evaluate the strength or weakness of economies or financial markets. Simply put, leading indicators change in advance of an economic cycle or market trend. In contrast, lagging indicators are based on previous events and provide insights about the historical data of a particular market or economy.
In other words, leading indicators provide predictive signals (before the occurrence of events or trends), and lagging indicators generate signals based on a trend that is already underway. These two classes of indicators are used extensively by investors and traders who employ technical analysis (TA), making them quite useful in stock, Forex, and cryptocurrency trading. 
Leading and Lagging Indicators Explained
In financial markets, TA indicators have a long history that stretches back to the early decades of the 20th century. The idea behind these indicators is rooted in the development of the Dow Theory, which occurred between 1902 and 1929. Essentially, the Dow Theory asserts that price movements are not random, and therefore can be predicted by using thorough analysis of prior market behavior.
Other than that, leading and lagging indicators are used for mapping economic performance. As such, they are not always related to technical analysis and market prices, but also to other economic variables and indexes.

How do leading and lagging indicators work?

Leading indicators

As mentioned, leading indicators that can provide information about trends that are yet to emerge. Therefore, these indicators may be used for predicting potential recessions or recoveries. For instance, in regards to stock market performance, retail sales, or building permits.
So, leading indicators tend to move ahead of economic cycles and are, in general, suitable for short and mid-term analyses. For example, building permits can be considered a kind of leading economic indicator. They may signal future demand for construction labor, and investments in the real estate market.

Lagging indicators

As opposed to leading indicators, lagging indicators are used to identify existing trends, which may not be immediately evident on their own. Thus, this type of indicator moves behind the economic cycles. 
Typically, lagging indicators are applied to long-term analyses, based on historical economic performance or previous price data. In other terms, lagging indicators produce signals based on a market trend or financial event that has already been initiated or established.

Coincident indicators

Although they are less popular in the cryptocurrency space, there is also a third class of indicators worth mentioning, which are known as coincident indicators. These indicators are somewhere in between the other two types. They work almost in real-time, providing information about the current economic situation.
For instance, a coincident indicator can be created by measuring the working hours of a group of employees or the production rate of a particular industry sector, such as manufacturing or mining.
It’s worth keeping in mind, however, that the definitions of leading, lagging, and coincident indicators are not always crystal clear. Some indicators may fall into different categories depending on the method and context. This is particularly common with economic indicators like the Gross Domestic Product (GDP).
Traditionally, GDP is considered a lagging indicator because it is calculated based on historical data. In some cases, however, it may reflect nearly instant economic changes, making it a coincident indicator.

Uses in technical analysis

As mentioned, economic indicators are also part of financial markets. Many traders and chartists deploy technical analysis tools that can be defined as either leading or lagging indicators.
Essentially, the leading TA indicators provide some sort of predictive information. They are usually based on market prices and trading volume. This means that they may indicate market movements that are likely to happen in the near future. But, just as any indicator, they are not always accurate.
Examples of leading indicators used in technical analysis include the Relative Strength Index (RSI) and the Stochastic RSI. In a sense, even the candlesticks may be considered as a type of leading indicator due to the patterns they create. In practice, these patterns may provide insights into future market events.
On the other hand, lagging TA indicators are based on previous data, giving traders insights about what has already happened. Still, they can come in handy when spotting the beginning of new market trends. For example, when an uptrend is over, and the price drops below a moving average, this could potentially indicate the start of a downtrend.
In some cases, the two types of indicators may be present in a single chart system. The Ichimoku Cloud, for instance, is composed of both leading and lagging indicators.
When used for technical analysis, both leading and lagging indicators have their advantages and disadvantages. By predicting future trends, leading indicators would seem to offer the best opportunities for traders. The problem, however, is that leading indicators frequently produce misleading signals.
Meanwhile, lagging indicators tend to be more reliable since they are clearly defined by previous market data. The obvious downside of lagging indicators, though, is their delayed reaction to market movements. In some cases, the signals may come relatively late for a trader to open a favorable position, resulting in lower potential gains.

Uses in macroeconomics

Beyond their usefulness in evaluating price market trends, indicators are also used to analyze macroeconomic trends. Economic indicators are different than those used for technical analysis, but can still be broadly classified into leading and lagging varieties.
In addition to the previously cited examples, other leading economic indicators include retail sales, housing prices, and the levels of manufacturing activity. In general, these indicators are assumed to drive future economic activity, or at least provide predictive insights. 
Other two classic examples of lagging macroeconomic indicators include unemployment and inflation rates. Along with GDP and CPI, these are commonly used when comparing the development levels of different countries – or when assessing the growth of a nation in comparison to previous years and decades.

Closing thoughts

Whether they are used in technical analysis or macroeconomics, leading and lagging indicators play an important role in many types of financial studies. They facilitate the interpretation of different kinds of data, often combining multiple concepts in a single instrument.
As such, these indicators can eventually predict future trends or confirm those that are already occurring. Other than that, they are also useful when evaluating the economic performance of a country. Either in relation to the previous years or in comparison to other countries.

Tutorials Trading Bitcoin, What is market psychology?

What is market psychology?

Market psychology is the idea that the movements of a market reflect (or are influenced by) the emotional state of its participants. It is one of the main topics of behavioral economics – an interdisciplinary field that investigates the various factors that precede economic decisions.
Many believe that emotions are the main driving force behind the shifts of financial markets. And that the overall fluctuating investor sentiment is what creates the so-called psychological market cycles.
In short, market sentiment is the overall feeling that investors and traders have regarding the price action of an asset. When the market’s sentiment is positive, and prices are rising continuously, there is said to be a bullish trend (often referred to as a bull market). The opposite is called a bear market, when there is an ongoing decline in prices.
So, the sentiment is made up of the individual views and feelings of all traders and investors within a financial market. Another way to look at it is as an average of the overall feeling of the market participants. 
The Psychology of Market Cycles
But, just as with any group, no single opinion is completely dominant. Based on market psychology theories, an asset’s price tends to change constantly in response to the overall market sentiment – which is also dynamic. Otherwise, it would be much harder to make a successful trade. 
In practice, when the market goes up, it is likely due to an improving attitude and confidence among the traders. A positive market sentiment causes demand to increase and supply to decrease. In turn, the increased demand may cause an even stronger attitude. Similarly, a strong downtrend tends to create a negative sentiment that reduces demand and increases the available supply.

How do emotions change during market cycles?

Uptrend

All markets go through cycles of expansion and contraction. When a market is in an expansion phase (a bull market), there is a climate of optimism, belief, and greed. Typically, these are the main emotions that lead to a strong buying activity.
It’s quite common to see a sort of cyclical or retroactive effect during market cycles. For example, the sentiment gets more positive as the prices go up, which then causes the sentiment to get even more positive, driving the market even higher.
Sometimes, a strong sense of greed and belief overtakes the market in such a way that a financial bubble can form. In such a scenario, many investors become irrational, losing sight of the actual value and buying an asset only because they believe the market will continue to rise. 
They get greedy and overhyped by the market momentum, hoping to make profits. As the price gets overextended to the upside, the local top is created. In general, this is deemed as the point of maximum financial risk.
In some cases, the market will experience a sideways movement for a while as the assets are gradually sold. This is also known as the distribution stage. However, some cycles don’t present a clear distribution stage, and the downtrend starts soon after the top is reached.

Downtrend

When the market starts to turn the other way, the euphoric mood can quickly turn into complacency, as many traders refuse to believe that the uptrend is over. As prices continue to decline, the market sentiment quickly moves to the negative side. It often includes feelings of anxiety, denial, and panic.
In this context, we may describe anxiety as the moment when investors start to question why the price is dropping, which soon leads to the denial stage. The denial period is marked by a sense of unacceptance. Many investors insist on holding their losing positions, either because “it’s too late to sell” or because they want to believe “the market will come back soon.”
But as the prices drop even further, the wave of selling gets stronger. At this point, fear and panic often lead to what is called a market capitulation (when holders give up and sell their assets close to the local bottom).
Eventually, the downtrend stops as the volatility decreases and the market stabilizes. Typically, the market experiences sideways movements before feelings of hope and optimism start arising once again. Such sideways period is also known as the accumulation stage.

How do investors use market psychology?

Assuming that the theory of market psychology is valid, understanding it may help a trader to enter and exit positions at more favorable times. The general attitude of the market is counterproductive: the moment of highest financial opportunity (for a buyer) usually comes when most people are hopeless, and the market is very low. In contrast, the moment of highest financial risk often arises when the majority of the market participants are euphoric and overconfident.
Thus, some traders and investors try to read the sentiment of a market to spot the different stages of its psychological cycles. Ideally, they would use this information to buy when there is panic (lower prices) and sell when there is greed (higher prices). In practice, though, recognizing these optimal points is rarely an easy task. What might seem like the local bottom (support) may fail to hold, leading to even lower lows.

Technical analysis and market psychology

It is easy to look back at market cycles and recognize how the overall psychology changed. Analyzing previous data makes it obvious what actions and decisions would have been the most profitable.
However, it is much harder to understand how the market is changing as it goes – and even harder to predict what comes next. Many investors use technical analysis (TA) to attempt to anticipate where the market is likely to go.
In a sense, we may say that TA indicators are tools that may be used when trying to measure the psychological state of the market. For instance, the Relative Strength Index (RSI) indicator may suggest when an asset is overbought due to a strong positive market sentiment (e.g., excessive greed).
The MACD is another example of an indicator that may be used to spot the different psychological stages of a market cycle. In short, the relation between its lines may indicate when market momentum is changing (e.g., buying force is getting weaker).

Bitcoin and market psychology

The Bitcoin bull market of 2017 is a clear example of how market psychology affects prices and vice-versa. From January to December, Bitcoin rose from roughly $900 to its all-time high of $20,000. During the rise, market sentiment became more and more positive. Thousands of new investors came on board, caught up in the excitement of the bull market. FOMO, excessive optimism, and greed quickly pushed prices up – until it didn’t.
The trend reversal started taking place in late 2017 and early 2018. The following correction left many of the late joiners with significant losses. Even when the downtrend was already established, false confidence and complacency caused many people to insist on HODLing
A few months later, the market sentiment became very negative as investors’ confidence reached an all-time low. FUD and panic caused many of those who bought close to the top to sell near the bottom, incurring in big losses. Some people became disillusioned with Bitcoin, although the technology was essentially the same. In fact, it is being improved continuously.

Cognitive biases

Cognitive biases are common thinking patterns that often cause humans to make irrational decisions. These patterns can affect both individual traders and the market as a whole. A few common examples are:
  • Confirmation bias: the tendency to overvalue information that confirms our own beliefs, while ignoring or dismissing information that runs contrary to them. For example, investors in a bull market may put a stronger focus on positive news, while ignoring bad news or signs that the market trend is about to reverse.
  • Loss aversion: the common tendency of humans to fear losses more than they enjoy gains, even if the gain is similar or greater. In other words, the pain of a loss is usually more painful than the joy of a gain. This may cause traders to miss good opportunities or to panic sell during periods of market capitulation.
  • Endowment effect: This is the tendency for people to overvalue things that they own, simply because they own it. For example, an investor that owns a bag of cryptocurrency is more likely to believe it has value than a no-coiner.

Closing thoughts

Most traders and investors agree that psychology has an impact on market prices and cycles. Although the psychological market cycles are well known, they are not always easy to deal with. From the Dutch Tulip Mania in the 1600s to the dotcom bubble in the 90s, even skilled traders have struggled to separate their own attitude from the overall market sentiment. Investors face the difficult task of understanding not only the market’s psychology but also their own psychology and how that is affecting their decision-making process.

Tutorials Trading,What is a futures contract?

What is a futures contract?

A futures contract is an agreement to buy or sell a commodity, currency, or another instrument at a predetermined price at a specified time in the future.
Unlike a traditional spot market, in a futures market, the trades are not ‘settled’ instantly. Instead, two counterparties will trade a contract, that defines the settlement at a future date. Also, a futures market doesn’t allow users to directly purchase or sell the commodity or digital asset. Instead, they are trading a contract representation of those, and the actual trading of assets (or cash) will happen in the future – when the contract is exercised.
As a simple example, consider the case of a futures contract of a physical commodity, like wheat, or gold. In some traditional futures markets, these contracts are marked for delivery, meaning that there is a physical delivery of the commodity. As a consequence, gold or wheat has to be stored and transported, which creates additional costs (known as carrying costs). However, many futures markets now have a cash settlement, meaning that only the equivalent cash value is settled (there is no physical exchange of goods).
Additionally, the price for gold or wheat in a futures market may be different depending on how far is the contract settlement date. The longer the time-gap, the higher the carrying costs, the larger the potential future price uncertainty, and the larger the potential price gap between the spot and futures market.

Why users trade futures contracts?

  • Hedging and risk management: this was the main reason why futures were invented.
  • Short exposure: traders can bet against an asset’s performance even if they don’t have it.
  • Leverage: traders can enter positions that are larger than their account balance. On Binanceperpetual futures contracts can be traded with a leverage that goes up to 125x.

Binance Futures Banner

What is a perpetual futures contract?

A perpetual contract is a special type of futures contract, but unlike the traditional form of futures, it doesn’t have an expiry date. So one can hold a position for as long as they like. Other than that, the trading of perpetual contracts is based on an underlying Index Price. The Index Price consists of the average price of an asset, according to major spot markets and their relative trading volume.
Thus, unlike conventional futures, perpetual contracts are often traded at a price that is equal or very similar to spot markets. Still, the biggest difference between the traditional futures and perpetual contracts is the ‘settlement date’ of the former.

What is the initial margin?

Initial margin is the minimum value you must pay to open a leveraged position. For example, you can buy 1000 BNB with an initial margin of 100 BNB (at 10x leverage). So your initial margin would be 10% of the total order. The initial margin is what backs your leveraged position, acting as collateral.

What is the maintenance margin?

Maintenance margin is the minimum amount of collateral you must hold to keep trading positions open. If your margin balance drops below this level, you will either receive a margin call (asking you to add more funds to your account) or be liquidated. Most cryptocurrency exchanges will do the latter.
In other words, the initial margin is the value you commit when opening a position, and the maintenance margin refers to the minimum balance you need to keep the positions open. The maintenance margin is a dynamic value that changes according to market price and to your account balance (collateral).

What is liquidation?

If the value of your collateral falls below the maintenance margin, your futures account may be subject to liquidation. On Binance, the liquidation occurs in different ways, according to the risk and leverage of each user (based on their collateral and net exposure). The larger the total position, the higher the required margin.
The mechanism differs depending on the market and exchange, but Binance charges a 0.5% nominal fee for Tier 1 liquidations (net exposure below 500,000 USDT). If the account has any extra funds after the liquidation, the remainder is returned to the user. If it has less, the user is declared bankrupt.
Note that when you are liquidated, you will pay additional fees. To avoid that, you can either close your positions before the liquidation price is reached or add more funds to your collateral balance – causing the liquidation price to move further away from the current market price.

What is the funding rate?

Funding consists of regular payments between buyers and sellers, according to the current funding rate. When the funding rate is above zero (positive), traders that are long (contract buyers) have to pay the ones that are short (contract sellers). In contrast, a negative funding rate means that short positions pay longs.
The funding rate is based on two components: the interest rate and the premium. On Binance futures market, the interest rate is fixed at 0.03%, and the premium varies according to the price difference between futures and spot markets. Binance takes no fees for funding rate transfers as they happen directly between users.
So when a perpetual futures contract is trading on a premium (higher than the spot markets), long positions have to pay shorts due to a positive funding rate. Such a situation is expected to drive the price down, as longs close their positions and new shorts are opened.

What is the mark price?

The mark price is an estimate of the true value of a contract (fair price) when compared to its actual trading price (last price). The mark price calculation prevents unfair liquidations that may happen when the market is highly volatile.
So while the Index Price is related to the price of spot markets, the mark price represents the fair value of a perpetual futures contract. On Binance, the mark price is based on the Index Price and the funding rate, and it is also an essential part of the “unrealized PnL” calculation.

What is PnL?

PnL stands for profit and loss, and it can be either realized or unrealized. When you have open positions on a perpetual futures market, your PnL is unrealized, meaning it’s still changing in response to market moves. When you close your positions, the unrealized PnL becomes realized PnL (either partially or entirely).
Because the realized PnL refers to the profit or loss that originate from closed positions, it has no direct relation to the mark price, but only to the executed price of the orders. The unrealized PnL, on the other hand, is constantly changing and is the primary driver for liquidations. Thus, the mark price is used to ensure that the unrealized PnL calculation is accurate and just.

What is the Insurance Fund?

Simply put, the Insurance Fund is what prevents the balance of losing traders to drop below zero, while also ensuring that winning traders get their profits.
To illustrate, let’s suppose that Alice has $2,000 in her Binance futures account, which is used to open a 10x BNB long position at $20 per coin. Note that Alice is buying contracts from another trader and not from Binance. So on the other side of the trade, we have Bob, with a short position of the same size.
Because of the 10x leverage, Alice now holds a 1,000 BNB position (worth $20,000), with a $2,000 collateral. However, if the BNB price drops from $20 to $18, Alice could have her position automatically closed. This means that her assets would be liquidated and her $2,000 collateral entirely lost.
If for whatever reason, the system is not able to close her positions on time and the market price drops more, the Insurance Fund will be activated to cover those losses until the position is closed. This wouldn’t change much for Alice, as she was liquidated and her balance is zero, but it ensures that Bob is able to get his profit. Without the Insurance Fund, Alice’s balance would not only drop from $2,000 to zero but could also become negative.
In practice, however, her long position would probably be closed before that because her maintenance margin would be lower than the minimum required. The liquidation fees go directly to the Insurance Fund, and any remaining funds are returned to the users.
So, the Insurance Fund is a mechanism designed to use the collateral taken from liquidated traders to cover losses of bankrupt accounts. In normal market conditions, the Insurance Fund is expected to grow continually as users are liquidated.
Summing up, the Insurance Fund gets bigger when users are liquidated before their positions reach a break-even or negative value. But in more extreme cases, the system may be unable to close all positions, and the Insurance Fund will be used to cover potential losses. Although uncommon, this could happen during periods of high volatility or low market liquidity.

What is Auto-deleveraging?

Auto-deleveraging refers to a method of counterparty liquidation that only takes place if the Insurance Fund stops functioning (during specific situations). Although unlikely, such an event would require profitable traders to contribute part of their profits to cover the losses of the losing traders. Unfortunately, due to the volatility present in the cryptocurrency markets, and the high leverage offered to clients, it is not possible to fully avoid this possibility.
In other terms, counterparty liquidation is the final step taken when the Insurance Fund cannot cover all bankrupt positions. Typically, the positions with the highest profit (and leverage) are the ones that contribute more. Binance makes use of an indicator that tells users where they are in the auto deleveraging queue.
On Binance Futures market, the system takes every possible step to avoid auto-deleveraging and has several features to minimize its impact. If it does occur, the counterparty liquidation is done without any market fees, and a notice is immediately sent to the affected traders. Users are free to re-enter positions at any time.

Trading Tutorials, Ichimoku Clouds Explained

Trading Tutorials, Ichimoku Clouds Explained

The Ichimoku Cloud is a method for technical analysis that combines multiple indicators in a single chart. It is used on candlestick charts as a trading tool that provides insights into potential support and resistance price zones. It is also used as a forecasting tool, and many traders employ it when trying to determine future trends direction and market momentum.
The Ichimoku Cloud was conceptualized in the late 1930s by a Japanese journalist named Goichi Hosada. However, his innovative trading strategy was only published in 1969, after decades of studies and technical improvements. Hosada called it Ichimoku Kinko Hyo, which translates from Japanese as “equilibrium chart at a glance.”
Ichimoku Clouds Explained

How does it work?

The Ichimoku Cloud system displays data based on both leading and lagging indicators, and the chart is made up of five lines:
  1. Conversion Line (Tenkan-sen): 9-period moving average.
  2. Base Line (Kijun-sen): 26-period moving average.
  3. Leading Span A (Senkou Span A): the moving average of the Conversion and Base Lines projected 26 periods in the future.
  4. Leading Span B (Senkou Span B): 52-period moving average projected 26 periods in the future.
  5. Lagging Span (Chikou Span): the closing price of the current period projected 26 periods in the past.
Ichimoku Clouds Explained
The space between the Leading Span A (3) and Leading Span B (4) is what produces the cloud (Kumo), which is likely the most notable element of the Ichimoku system. The two lines are projected 26 periods in the future to provide forecasting insights and, as such, are considered leading indicators. The Chikou Span (5), on the other hand, is a lagging indicator projected 26 periods in the past.
By default, the clouds are displayed in either green or red – to make the reading easier. A green cloud is created when the Leading Span A (green cloud line) is higher than Leading Span B (red cloud line). Naturally, a red cloud results from the opposite situation.
It is worth noting that – unlike other methods – the moving averages used by the Ichimoku strategy are not based on the closing prices of the candles. Instead, the averages are calculated based on the high and low points recorded within a given period (high-low average). 
For instance, the standard equation for a 9-day Conversion Line is:
Conversion Line = (9d high + 9d low) / 2

Ichimoku settings

After over three decades of research and testing, Goichi Hosada concluded that the  (9, 26, 52) settings had the best results. Back then, the Japanese business schedule included Saturdays, so the number 9 represents a week and a half (6 + 3 days). The numbers 26 and 52 represent one and two months, respectively.
While these settings are still preferred in most trading contexts, chartists are always able to adjust them to fit different strategies. In cryptocurrency markets, for example, many traders adjust the Ichimoku settings to reflect the 24/7 markets – often changing from (9, 26, 52) to (10, 30, 60). Some go even further and adjust the settings to (20, 60, 120) as a way to reduce false signals.
Still, there is an ongoing debate about how efficient modifying the settings may be. While some argue it makes sense to adjust them, others claim that abandoning the standard settings would disrupt the balance of the system and produce lots of invalid signals.

Analyzing the chart

Ichimoku trading signals

Due to its multiple elements, the Ichimoku Cloud produces different types of signals. We may divide them into momentum and trend-following signals.
Momentum signals: are generated according to the relationship between the market price, Base Line, and Conversion Line. Bullish momentum signals are produced when either or both the Conversion Line and the market price move above the Base Line. Bearish momentum signals are generated when either or both Conversion Line and market price move below the Base Line. The crossing between the Conversion Line (Tenkan-sen) and the Base Line (Kijun-sen) is often referred to as a TK cross.
Trend-following signals: are generated according to the color of the cloud and to the position of the market price in relation to the cloud. As mentioned, the cloud color reflects the difference between the Leading Spans A and B.
Simply put, when prices are consistently above the clouds, there is a higher probability that the asset is in an upward trend. In contrast, prices moving below the clouds may be interpreted as a bearish sign, indicating a downtrend. Save a few exceptions, the trend may be considered flat or neutral when prices are doing sideway movements inside the cloud.
The Lagging Span (Chikou Span) is another element that can help traders spot and confirm potential trend reversals. It provides insights into the strength of price action, possibly confirming a bullish trend when moving above market prices, or a bearish trend when below. Normally, the Lagging Span is used in conjunction with the other components of the Ichimoku Cloud, and not on its own.
Summing up:
  • Momentum signals
    • Market price moving above (bullish) or below (bearish) the Base Line.
    • TK cross: Conversion Line moving above (bullish) or below (bearish) the Base Line.
  • Trend-following signals
    • Market price moving above (bullish) or below (bearish) the cloud.
    • Cloud color changes from red to green (bullish) or from green to red (bearish).
    • Lagging Span above (bullish) or below (bearish) market prices.

Support and resistance levels

The Ichimoku chart can also be used to identify support and resistance zones. Typically, the Leading Span A (green cloud line) acts as a support line during uptrends and as a resistance line during downtrends. In both cases, the candlesticks tend to move closer to the Leading Span A, but if the price moves into the cloud, the Leading Span B may also act as a support/resistance line. What’s more, the fact that both Leading Spans are projected 26 periods in the future allows traders to anticipate potential coming support and resistance zones.

Signal strength

The strength of the signals generated by the Ichimoku Cloud depends heavily on whether they fall in line with the broader trend. A signal that is part of a larger, clearly defined trend will always be stronger than one that crops up briefly in opposition to the prevailing trend.
In other terms, a bullish signal may be misleading if not accompanied by a bullish trend. So, whenever a signal is generated, it is important to acknowledge the color and position of the cloud. The trading volume is also something to be considered.
Mind that using Ichimoku with shorter timeframes (intraday charts) tends to generate a lot of noise and false signals. Generally speaking, longer timeframes (daily, weekly, monthly charts) will produce more reliable momentum and trend-following signals.

Closing thoughts

Goichi Hosada dedicated over 30 years of his life to create and refine the Ichimoku system, which is now employed by millions of traders worldwide. As a versatile charting method, Ichimoku Clouds are used to identify both market trends and momentum. Also, the Leading Spans make it easier for chartists to anticipate potential levels of support and resistance that are yet to be tested.
Although the charts may look too busy and quite complex at first, they don’t rely on subjective human input like other methods of technical analysis (e.g., drawing trend lines). And despite the continuous debate about Ichimoku settings, the strategy is relatively easy to use. 
As with any indicator, though, it should be used in conjunction with other techniques to confirm trends and minimize trading risks. The sheer amount of information that this chart displays may also be overwhelming for beginners. For these traders, it’s usually a good idea to become comfortable with more basic indicators before tackling the Ichimoku Cloud.

Tutorials Trading Binance, What Are Options Contracts?

What Are Options Contracts?

An options contract is an agreement that gives a trader the right to buy or sell an asset at a predetermined price, either before or at a certain date. Although it may sound similar to futures contracts, traders that buy options contracts are not obligated to settle their positions. 
Options contracts are derivatives that can be based on a wide range of underlying assets, including stocks, and cryptocurrencies. These contracts may also be derived from financial indexes. Typically, options contracts are used for hedging risks on existing positions and for speculative trading.
What Are Options Contracts?

How do options contracts work?

There are two basic types of options, known as puts and calls. Call options give contract owners the right to buy the underlying asset, while put options confer the right to sell. As such, traders usually enter into calls when they expect the price of the underlying asset to increase, and puts when they expect the price to decrease. They may also use calls and puts hoping for prices to remain stable – or even a combination of the two types – to bet in favor or against market volatility.
An options contract consists of at least four components: size, expiration date, strike price, and premium. First, the size of the order refers to the number of contracts to be traded. Second, the expiration date is the date after which a trader can no longer exercise the option. Third, the strike price is the price at which the asset will be bought or sold (in case the contract buyer decides to exercise the option). 
Finally, the premium is the trading price of the options contract. It indicates the amount an investor must pay to obtain the power of choice. So buyers acquire contracts from writers (sellers) according to the value of the premium, which is constantly changing, as the expiration date gets closer.
Basically speaking, if the strike price is lower than the market price, the trader can buy the underlying asset at a discount and, after including the premium into the equation, they may choose to exercise the contract to make a profit. But if the strike price is higher than the market price, the holder has no reason to exercise the option, and the contract is deemed useless. When the contract is not exercised, the buyer only loses the premium paid when entering the position.
It is important to note that although the buyers are able to choose between exercising or not their calls and puts, the writers (sellers) are dependent on the buyers’ decision. So if a call option buyer decides to exercise his contract, the seller is obligated to sell the underlying asset. Similarly, if a trader buys a put option and decides to exercise it, the seller is obligated to buy the underlying asset from the contract holder. This means that writers are exposed to higher risks than buyers. While buyers have their losses limited to the premium paid for the contract, writers can lose much more depending on the asset’s market price.
Some contracts give traders the right to exercise their option anytime before the expiration date. These are usually referred to as American option contracts. In contrast, the European options contracts can only be exercised at the expiration date. It is worth noting, however, that these denominations have nothing to do with their geographical location.

Options premium

The value of the premium is affected by multiple factors. To simplify, we may assume that the premium of an option is dependent on at least four elements: the underlying asset’s price, the strike price, the time left until the expiration date, and the volatility of the corresponding market (or index). These four components present different effects on the premium of calls and put options, as illustrated in the following table.


Call options premium
Put options premium
Rising asset’s price
Increases
Decreases
Higher strike price
Decreases
Increases
Decreasing time
Decreases
Decreases
Volatility
Increases
Increases

Naturally, the asset’s price and strike price influence the premium of calls and puts in an opposing way. In contrast, less time usually means lower premium prices for both types of options. The main reason for that is because traders would have a lower probability of those contracts turning in their favor. On the other hand, increased levels of volatility usually cause premium prices to rise. As such, the option contract premium is a result of those and other forces combined.

Options Greeks

Options Greeks are instruments designed to measure some of the multiple factors that affect the price of a contract. Specifically, they are statistical values used to measure the risk of a particular contract based on different underlying variables. Following are some of the primary Greeks and a brief description of what they measure:
  • Delta: measures how much the price of an options contract will change in relation to the underlying asset’s price. For instance, a Delta of 0.6 suggests that the premium price will likely move $0.60 for every $1 move in the asset’s price.
  • Gamma: measures the rate of change in Delta over time. So if Delta changes from 0.6 to 0.45, the option’s Gamma would be 0.15.
  • Theta: measures price change in relation to a one-day decrease in the contract’s time. It suggests how much the premium is expected to change as the options contract gets closer to expiration.
  • Vega: measures the rate of change in a contract price in relation to a 1% change in the implied volatility of the underlying asset. An increase in Vega would normally reflect an increase in the price of both calls and puts.
  • Rho: measures expected price change in relation to fluctuations in interest rates. Increased interest rates generally cause an increase in calls and a decrease in puts. As such, the value of Rho is positive for call options and negative for put options.

Common use cases

Hedging

Options contracts are widely used as hedging instruments. A very basic example of a hedging strategy is for traders to buy put options on stocks they already hold. If the overall value is lost in their main holdings due to price declines, exercising the put option can help them mitigate losses.
For example, imagine that Alice bought 100 shares of a stock at $50, hoping for the market price to increase. However, to hedge against the possibility of stock prices falling, she decided to buy put options with a strike price of $48, paying a $2 premium per share. If the market turns bearish and the stock declines to $35, Alice can exercise her contract to mitigate losses, selling each share for $48 instead of $35. But if the market turns bullish, she doesn’t need to exercise the contract and would only lose the premium paid ($2 per share).
In such a scenario, Alice would break even at $52 ($50 + $2 per share), while her losses would be limited to -$400 ($200 paid for the premium and $200 more if she sells each share for $48).
What Are Options Contracts?

Speculative trading

Options are also widely used for speculative trading. For instance, a trader who believes that an asset’s price is about to go up can buy a call option. If the price of the asset moves above the strike price, the trader can then exercise the option and buy it at a discount. When an asset’s price is above or below the strike price in a way that makes the contract profitable, the option is said to be “in-the-Money.” Likewise, a contract is said to be “at-the-Money” if on its breakeven point, or “out-of-the-Money” if in a loss.

Basic strategies

When trading options, traders can employ a wide range of strategies, which are based on four basic positions. As a buyer, one can buy a call option (right to buy) or put option (right to sell). As a writer, one can sell call or put options contracts. As mentioned, writers are obligated to buy or sell the assets if the contract holder decides to exercise it.
The different options trading strategies are based on the various possible combinations of call and put contracts. Protective puts, covered calls, straddle, and strangle are some basic examples of such strategies.
  • Protective put: involves buying a put option contract of an asset that is already owned. This is the hedging strategy used by Alice in the previous example. It is also known as portfolio insurance as it protects the investor from a potential downtrend, while also maintaining their exposure in case the asset’s price increases.
  • Covered call: involves selling a call option of an asset that is already owned. This strategy is used by investors to generate additional income (options premium) from their holdings. If the contract is not exercised, they earn the premium while keeping their assets. However, if the contract is exercised due to an increase in the market price, they are obligated to sell their positions.
  • Straddle: involves buying a call and a put on the same asset with identical strike prices and expiration dates. It allows the trader to profit as long as the asset moves far enough in either direction. Simply put, the trader is betting on market volatility.
  • Strangle: involves buying both a call and a put that are “out-of-the-Money” (i.e., strike price above market price for call options and below for put options). Basically, a strangle is like a straddle, but with lower costs for establishing a position. However, a strangle requires a higher level of volatility to be profitable.

Advantages

  • Suitable for hedging against market risks.
  • More flexibility in speculative trading.
  • Allow for several combinations and trading strategies, with unique risk/reward patterns.
  • Potential to profit from all the bull, bear, and side-way market trends.
  • May be used for reducing costs when entering positions.
  • Allow multiple trades to be performed simultaneously.

Disadvantages

  • Working mechanisms and premium calculation not always easy to understand.
  • Involves high risks, especially for contract writers (sellers)
  • More complex trading strategies when compared to conventional alternatives.
  • Options markets are often plagued with low levels of liquidity, making them less attractive for most traders.
  • The premium value of options contracts is highly volatile and tends to decrease as the expiration date gets closer.

Options vs. futures

Options and futures contracts are both derivative instruments and, as such, present some common use cases. But despite their similarities, there is a major difference in the settlement mechanism between the two.
Unlike options, futures contracts are always executed when the expiration date is reached, meaning that the contract holders are legally obligated to exchange the underlying asset (or respective value in cash). Options, on the other hand, are only exercised at the discretion of the trader who holds the contract. If the contract holder (buyer) exercises the option, the contract writer (seller) is obligated to trade the underlying asset.

Closing thoughts

As the name suggests, options give an investor the choice to buy or sell an asset in the future, regardless of the market price. These type of contracts are very versatile and can be used in various scenarios – not only for speculative trading but also for performing hedging strategies. 
Yet, it is worth noting that trading options, as well as other derivatives, involves many risks. So before making use of this type of contract, traders should have a good understanding of how it works. It is also important to have a good understanding of the different combinations of calls and puts and the potential risks involved in each strategy. Also, traders should also consider employing risk management strategies along with technical and fundamental analyses to limit the potential losses.

Binance Totorials, Guide to Trading on Binance Futures

How to open a Binance Futures account

Video tutorial available here
Before opening a Binance Futures account, you need a regular Binance account. If you don’t have one, you can go to Binance and click on Register in the top right corner of your screen. Then follow these steps:
  1. Enter your email address and create a safe password. If you have a referral ID, paste it in the referral ID box. For a 10% discount on spot/margin trading fees, you can use this link.
    How to open a binance futures account
  2. When you are ready, click on Create account.
  3. You will receive a verification email shortly. Follow the instructions in the email to complete your registration.
Next, log in to your Binance account, move your mouse to the bar at the top of the page, hover over Trade, and click on Futures.

Once you are on the Binance Futures page, you should be able to see the first two characters of your email address associated with your account in the top right corner.
How to open a binance futures account
Click on the Open now button in the bottom right corner to activate your Binance Futures account. And that’s it. You’re ready to trade!

How to open a binance futures account
If you are not familiar with trading futures contracts, we recommend reading the articles What Are Forward and Futures Contracts?, and What Are Perpetual Futures Contracts? before getting started.
You may also refer to the Binance Futures FAQ to get an overview of the contract specifications. 
If you would like to test out the platform without risking real funds, you can try out the Binance Futures testnet

How to fund your Binance Futures account

Video tutorial available here
You can transfer funds back and forth between your Exchange Wallet (the wallet that you use on Binance) and your Futures Wallet (the wallet that you use on Binance Futures).

If you don’t have any funds deposited to Binance, we recommend reading the guide How to Deposit on Binance.

To transfer funds to your Futures Wallet, click on Transfer in the bottom right corner of the Binance Futures page. Set the amount that you would like to transfer and click on Confirm transfer. You should be able to see the balance added to your Futures Wallet shortly. 

How to open a binance futures account

Binance Futures interface guide


How to open a binance futures account

  1. This is where you can:
    1. Choose the contract you’d like to trade, adjust your leverage (20x by default), and switch between cross margin and isolated margin.
    2. Check the Mark Price (important to keep an eye on, as liquidations happen based on the Mark Price).
    3. Check the expected funding rate.
    4. Monitor your position in the auto-deleverage queue (important to pay attention to during periods of high volatility).
    5. Check various other market data, such as 24h change and 24h volume.
  2. This is your chart. In the top right corner of this area, you can switch between the Original or the integrated TradingView chart, or get a real-time visual representation of the current order book depth by clicking on Depth.
  3. This is where you can monitor your trading activity. You can switch between the tabs to check the current status of your positions, your margin balance, see your currently open and previously executed orders, and get a full trading and transaction history for a given period.
  4. This is where you can enter your orders, and switch between different order types. This is also where you can check your fee tier, and transfer funds from your Binance account.
  5. This is where you can see live order book data along with a visualization of order depth. You can adjust the accuracy of the order book in the dropdown menu on the top right corner of this area (0.01 by default).
  6. This is where you can see a live feed of the trade history of Binance Futures.
  7. By hovering on Info, you can get access to the Futures FAQ, check the historical funding rates, and the current balance of the Insurance Fund. If you wish to log out of Binance Futures, you can also do that from here. 

How to adjust your leverage

Video tutorial available here
Binance Futures allows you to trade multiple contracts and manually adjust the leverage for each one. To choose the contract, go to the top of the page and hover over the current contract (BTCUSDT by default). 
To adjust the leverage, click on the yellow box indicating your current leverage amount (20x by default). Specify the amount of leverage by adjusting the slider, or by typing it in, and click on Confirm.

How to adjust your leverage

It’s worth noting that the larger the position size is, the smaller the amount of leverage is that you can use. Similarly, the smaller the position size, the larger the leverage you can use.
Please note that using higher leverage carries a higher risk of liquidation. Novice traders should carefully consider the amount of leverage that they use. 

What is the difference between the Mark Price and Last Price?

To avoid spikes and unnecessary liquidations during periods of high volatility, Binance Futures uses Last Price and Mark Price.
The Last Price is easy to understand. It means the Last Price that the contract was traded at. In other words, the last trade in the trading history defines the Last Price. It’s used for calculating your realized PnL (Profit and Loss).
The Mark Price is designed to prevent price manipulation. It’s calculated using a combination of funding data and a basket of price data from multiple spot exchanges. Your liquidation prices and unrealized PnL are calculated based on the Mark Price.

What is the difference between mark price and last price

Please note that the Mark Price and the Last Price may differ. 
When you set an order type that uses a stop price as a trigger, you can select which price you would like to use as the trigger – the Last Price or the Mark Price. To do this, select the price you wish to use in the Trigger dropdown menu in the order entry field.

Binance Futures Banner

What order types are available and when to use them?

There are six order types that you can use on Binance Futures:
  • Limit: A limit order is an order that you place on the order book with a specific limit price that is determined by you. When you place a limit order, the trade will only be executed if the market price reaches your limit price (or better). Therefore, you may use limit orders to buy at a lower price, or to sell at a higher price than the current market price.
  • Market: A market order is an order to buy or sell at the best available current price. It is executed against the limit orders that were previously placed on the order book. When placing a market order, you will pay fees as a market taker.
  • Stop-Limit: The easiest way to understand a stop-limit order is to break it down into stop price, and limit price. The stop price is simply the price that triggers the limit order, and the limit price is the price of the limit order that is triggered. This means that once your stop price has been reached, your limit order will be immediately placed on the order book.

    Although the stop and limit prices can be the same, this is not a requirement. In fact, it would be safer for you to set the stop price (trigger price) a bit higher than the limit price for sell orders, or a bit lower than the limit price for buy orders. This increases the chances of your limit order getting filled after the stop price is reached.

  • Stop-Market: Similarly to a stop-limit order, a stop-market order uses a stop price as a trigger. However, when the stop price is reached, it triggers a market order instead.
  • Take-Profit-Limit: If you understand what a stop-limit order is, you will easily understand what a take-profit-limit order is. Similarly to a stop-limit order, it involves a trigger price, the price that triggers the order, and a limit price, the price of the limit order that is then added to the order book. The key difference between a stop-limit order and a take-profit-limit order is that a take-profit-limit order can only be used to reduce open positions.
    A take-profit-limit order can be a useful tool to manage risk and lock in profit at specified price levels. It can also be used in conjunction with other order types, such as stop-limit orders, allowing you to have more control over your positions.
    Please note that these are not OCO orders. For example, if your stop-limit order is hit while you also have an active take-profit-limit order, the take-profit-limit order remains active until you manually cancel it.
    You can set a take-profit-limit order under the Stop Limit option in the order entry field.
  • Take-Profit-Market: Similarly to a take-profit-limit order, a take-profit-market order uses a stop price as a trigger. However, when the stop price is reached, it triggers a market order instead.
    You can set a take-profit-market order under the Stop Market option in the order entry field.

How to use the Binance Futures calculator

Video tutorial available here.
You can find the calculator next to the Transfer button in the bottom right corner. It allows you to calculate values before entering either a long or a short position. You can adjust the leverage slider in each tab to use it as a basis for your calculations.
The calculator has three tabs:
  • PNL – Use this tab to calculate your Initial Margin, Profit and Loss (PnL), and Return on Equity (ROE) based on intended entry and exit price, and position size. 
  • Target Price – Use this tab to calculate what price you’ll need to exit your position at to reach a desired percentage return.
  • Liquidation Price – Use this tab to calculate your estimated liquidation price based on your wallet balance, your intended entry price, and position size.


What is Post-Only, Time in Force and Reduce-Only?

When you use limit orders, you can set additional instructions along with your orders. On Binance Futures, these can either be Post-Only or Time in Force (TIF) instructions, and they determine additional characteristics of your limit orders.

Post-Only means that your order will always be added to the order book first and will never execute against an existing order in the order book. This is useful if you would only like to pay maker fees. You can quickly check your current fee tier by hovering over the $ sign next to the Transfer button.

TIF instructions allow you to specify the amount of time that your orders will remain active before they are executed or expired. You can select one of these options for TIF instructions:
  • GTC (Good Till Cancel): The order will remain active until it is either filled or canceled.
  • IOC (Immediate Or Cancel): The order will execute immediately (either fully or partially). If it is only partially executed, the unfilled portion of the order will be canceled.
  • FOK (Fill Or Kill): The order must be fully filled immediately. If not, it won’t be executed at all.
Additionally, when you use either a limit or a market order, ticking the Reduce-Only checkbox will ensure that new orders you set will only decrease, and never increase your currently open positions.

When are your positions at risk of getting liquidated?

Liquidation happens when your Margin Balance falls below the required Maintenance Margin. The Margin Balance is the balance of your Binance Futures account, including your unrealized PnL (Profit and Loss). So, your profits and losses will cause the Margin Balance value to change.
The Maintenance Margin is the minimum value you need to keep your positions open. It varies according to the size of your positions. Larger positions require higher Maintenance Margin.
You can find a useful tool under the Positions tab at the bottom left corner of the page. It helps you quickly track the current risk of your open positions getting liquidated. If your Margin Ratio reaches 100%, your positions will be liquidated.

When are your positions at risk of getting liquidated

When liquidation happens, all of your open orders are canceled. Ideally, you should keep track of your positions to avoid auto-liquidation, which comes with an additional fee. If your position is close to being liquidated, it may be beneficial to consider manually closing the position instead of waiting for the auto-liquidation.

What is auto-deleveraging and how can it affect you?

When a trader’s account size goes below 0, the Insurance Fund is used to cover the losses. However, in some exceptionally volatile market environments, the Insurance Fund may be unable to handle the losses, and open positions have to be reduced to cover them. This means that in times like these, your open positions can also be at risk of being reduced.
The order of these position reductions is determined by a queue, where the most profitable and the highest leveraged traders are at the front of the queue. You can check your current position in the queue by hovering over the indicator at the top of the page.

what is auto-deleveraging