Note: We highly recommend reading our guides on limit and stop-limit orders prior to continuing.
An OCO, or “One Cancels the Other” order allows you to place two orders at the same time. It combines a limit order, with a stop-limit order, but only one of the two can be executed.
In other words, as soon as one of the orders get partially or fully filled, the remaining one will be canceled automatically. Note that canceling one of the orders will also cancel the other one.
When trading on the Binance Exchange, you can use OCO orders as a basic form of trade automation. This feature gives you the option of placing two limit orders simultaneously, which may come handy for taking profit and minimizing potential losses.
How to use OCO orders?
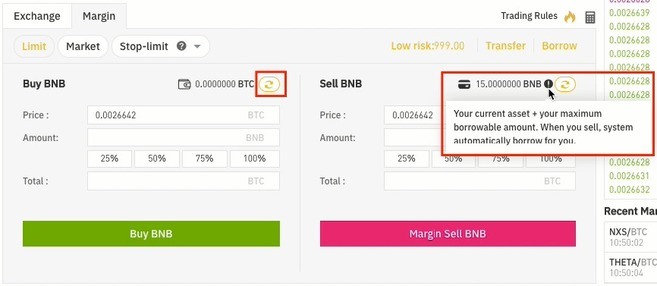
After logging in to your Binance account, go to the Basic Exchange interface and find the trading area as illustrated below. Click on “Stop-limit order” to open a dropdown menu and select “OCO.”
On Binance, OCO orders can be placed as a pair of buying or selling orders. You can find more information about OCO orders by clicking on the question mark.
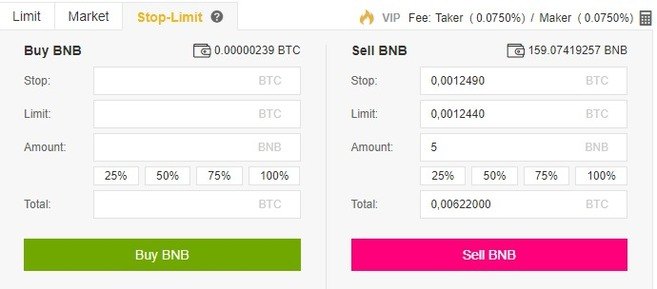
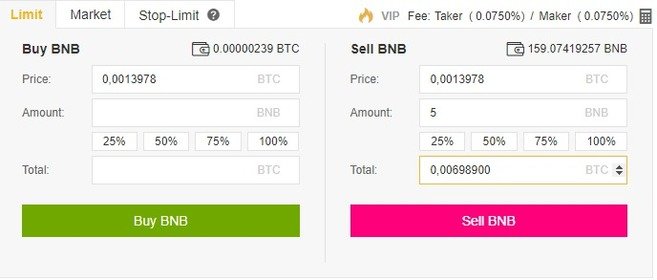
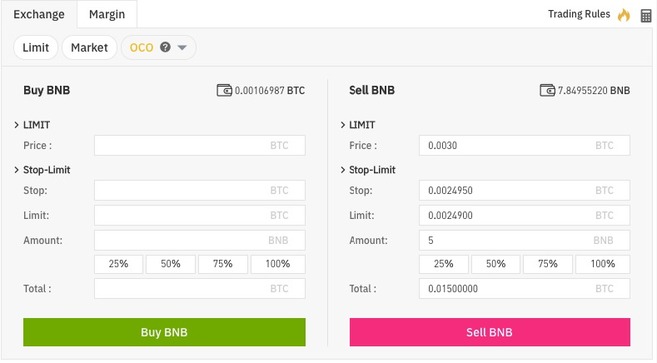
After selecting the OCO option, a new trading interface will be loaded, as shown below. This interface allows you to set a limit and a stop-limit order simultaneously.
Limit order
Price: The price of your limit order. This order will be visible on the order book.
Stop-Limit
Stop: The price at which your stop-limit order will be triggered (e.g., 0.0024950 BTC). Limit: The actual price of your limit order after the stop is triggered (e.g., 0.0024900 BTC).
Amount: The size of your order (e.g., 5 BNB).
Total: The total value of your order.
After placing your OCO order, you can scroll down to visualize the details of both orders on the “Open Orders” section.
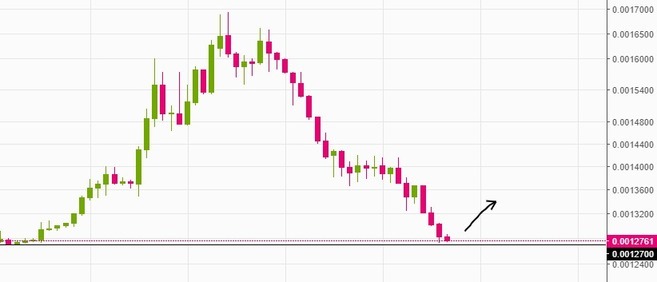
As an example, let’s suppose that you just bought 5 BNB at 0.0026837 BTC because you believe the price is close to a major support zone and will presumably go up.
In this case, you can use the OCO feature to place a profit-taking order at 0.0030 BTC along with a stop-limit order at 0.0024900 BTC.
If your prediction is correct and price rises to or above 0.0030 BTC, your sell order will be executed, and the stop-limit order will be automatically canceled.
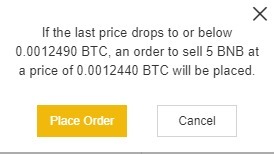
On the other hand, if you end up being wrong and the price drops to 0.0024950 BTC, your stop-limit order would be triggered. This would potentially minimize your losses, in case the price drops even more.
Note that in this example, the Stop Price is 0.0024950 (trigger price) and the Limit Price is 0.0024900 (the trading price of your order). This means that your stop-limit order would be triggered at the moment the 0.0024950 mark is reached. But, the actual trading price of your order would be 0.0024900. Put in another way, if BNB/BTC drops to or below 0.0024950, a limit sell order at 0.0024900 will be placed.
The OCO feature is a simple but powerful tool, which allows you and other Binance users to trade in a more secure and versatile way. This special type of order can be useful for locking profits, limiting risks, and even for entering and exiting positions. Still, it’s important to have a good understanding of limit and stop-limit orders before using OCO orders.
A stop-limit order is one of the many order types you will find on Binance. However, before proceeding with this one, we recommend you to first learn about limit and market orders.
The best way to understand a stop-limit order is to break it down into stop price and limit price. The stop price is simply the price that triggers a limit order, and the limit price is the specific price of the limit order that was triggered. This means that once your stop price has been reached, your limit order will be immediately placed on the order book.
Although the stop and limit prices can be the same, this is not a requirement. In fact, it would be safer for you to set the stop price (trigger price) a bit higher than the limit price (for sell orders) or a bit lower than the limit price (for buy orders). This increases the chances of your limit order getting filled after the stop-limit is triggered.
How to use it?
Let’s say you just bought 5 BNB at 0.0012761 BTC because you believe the price is close to a major support level and will likely go up from here.
In this situation, you may want to set a stop-limit sell order to alleviate your losses in case your assumption is wrong, and the price starts to drop. To do that, log in to your Binance account and go to the BNB/BTC market. Then click on the Stop-Limit tab and set the stop and limit price, along with the amount of BNB to be sold.
So if you believe that 0.0012700 BTC is a reliable support level, you may set a stop-limit order just below this price (in case it doesn’t hold). In this example, we will set a stop-limit order for 5 BNB with the stop price at 0.0012490 BTC and the limit price at 0.0012440 BTC.
When you click Sell BNB, a confirmation window will appear. Make sure everything is correct and press Place Order to confirm.
After placing your stop-limit order, you will see a confirmation message.
You can scroll down to see and manage your open orders.
Note that the stop-limit order will only be placed if and when the stop price is reached, and the limit order will only be filled if the market price reaches your limit price. If your limit-order is triggered (by the stop price), but the market price doesn’t reach the price you set, the limit order will remain open.
Sometimes you might be in a situation where the price drops too fast, and your stop-limit order is passed over without being filled. In this case, you may appeal to market orders to quickly get out of the trade.
When should you use it?
Stop-limit orders are valuable as a risk management tool, and you should use it to avoid significant losses. Noteworthy, they are also useful for placing Sell orders to ensure that you take your profits when your trading targets are reached. You may also set a stop-limit buy order to buy an asset after a certain resistance level is breached during the start of an uptrend.
A market order is an order to quickly buy or sell at the best available current price. It needs liquidity to be filled, meaning that it is executed based on the limit orders that were previously placed on the order book.
Unlike limit orders, where orders are placed on the order book, market orders are executed instantly at the current market price, meaning that you pay the fees as a market taker.
How to use it?
Let’s say you want to create a market order to buy 2 BNBs. After logging in to your Binance account, choose the BNB market you want (e.g., BNB/USDT) and go to the trading page. Then, find the Market order tab, set the amount to 2 BNB, and click the Buy BNB button.
After that, you will see a confirmation message on the screen, and your market order will be executed.
Since market orders are executed right away, your market buy order will match the cheapest limit sell order available on the order book, in this example 2 BNB for 5.2052 USDT each.
But let’s say you want to buy 500 BNB at the current market price. The cheapest limit sell order available will not be sufficient to fill your entire market buy order, so your order will automatically match the following limit sell orders, working its way up the order book until it is completed. This is called slippage and is the reason why you pay higher prices and higher fees (because you are acting as a market taker).
When should you use it? Market orders are handy in situations where getting your order filled is more important than getting a certain price. This means that you should only use market orders if you are willing to pay higher prices and fees caused by the slippage. In other words, market orders should only be used if you are in a rush.
Sometimes you might be in a situation where you had a stop-limit order that was passed over, and you need to buy/sell as soon as possible. So if you need to get into a trade right away or get yourself out of trouble, that’s when market orders come in handy.
However, if you’re just coming into crypto for the first time and you are using Bitcoin to buy some altcoins, avoid using market orders because you will be paying way more than you should. In this case, you should use limit orders.
A limit order is an order that you place on the order book with a specific limit price. The limit price is determined by you. So when you place a limit order, the trade will only be executed if the market price reaches your limit price (or better). Therefore, you may use limit orders to buy at a lower price or to sell at a higher price than the current market price.
Unlike market orders, where trades are executed instantly at the current market price, limit orders are placed on the order book and are not executed immediately, meaning that you save on fees as a market maker.
How to use it?
Let’s say you want to sell BNB at a higher price than what is currently being bid. After logging in to your Binance account, choose the BNB market you want (e.g., BNB/BTC) and go to the trading page. Then, find the Limit order tab, set the price and amount, and click the Sell BNB button. You may also set the amount by clicking the percentage buttons, so you can easily place a limit sell order for 25%, 50%, 75% or 100% of your balance.
After that, you will see a confirmation message on the screen, and your limit order will be placed on the order book, with a small yellow arrow.
You can scroll down to see and manage your open orders. The limit order will only execute if the market price reaches your limit price. If the market price doesn’t reach the price you set, the limit order will remain open.
When should you use it?
You should use limit orders when you are not in a rush to buy or sell. Unlike market orders, the limit orders are not executed instantly, so you need to wait until your ask/bid price is reached. Limit orders allow you to get better selling and buying prices and they are usually placed on major support and resistance levels. You may also split your buy/sell order into many smaller limit orders, so you get a cost average effect.
After logging in to yourBinanceaccount, move your mouse to the top right corner to and hover over your profile icon. This will be different for everyone and will show the first two characters of your email address. When the dropdown opens, click on your email to go to your account dashboard.
If you don’t know what margin trading is, we recommend reading our article “What is Margin Trading” before opening your margin trading account on Binance.
You will now be on your account dashboard. You can see your account balances from this page. Below “Balance Details” click on “Margin” to begin the process of opening your margin trading account on Binance. You will need to have completed identity verification (KYC) and make sure your country is not in the blacklist. It is also mandatory that you enable 2FA.
Next, you will see a reminder about the risks of margin trading. Please read it and, if you are willing to proceed, click on the “Open margin account” button.
Please take the time to read the margin account agreement carefully. If you understand and agree to the Terms and Conditions, tick the box and click “I understand.”
How to transfer funds
After activating your margin account, you will be able to transfer funds from your regular Binance Wallet to your Margin Trading Wallet. To do so, click on the “Wallet” tab, select “Margin” and click on the “Transfer” button on the right side of the page.
Next, select which coin you wish to transfer. In this case, we will use the BNB.
Input the amount you want to transfer from your Exchange Wallet to your Margin Wallet and click “Confirm transfer.”
How to borrow funds
After transferring BNB coins to your Margin Wallet, you will be able to use those coins as collateral to borrow funds. Your Margin Wallet balance determines the amount of funds you can borrow, following a fixed rate of 5:1 (5x). So if you have 1 BTC, you can borrow 4 more. In this example, we will borrow 0.02 BTC.
After selecting the coin you wish to borrow and the amount, click “Confirm borrow.”
Next, your margin account will be credited with the Bitcoin you borrowed. You will now be able to trade the borrowed funds while having a debt of 0.02 BTC plus the interest rate. The interest rate is updated every 1 hour. You can check the currently available pairs as well as their rates on the Margin Fee page.
You can check your current margin account status by going to your “Wallet Balance” page and selecting the “Margin” tab.
The Margin Level
On the right side of the screen, you will see your margin level, which gives you a risk level according to the borrowed funds (Total Debt) and to the funds you hold as collateral on your margin account (Account Equity).
The risk level changes according to the market movements, so if the prices move against your prediction, your assets can be liquidated. Note that in case you are liquidated, you will be charged extra fees.
The formula to calculate the margin level is:
Margin Level = Total Asset Value / (Total Borrowed + Total Accrued Interest)
If your margin level drops to 1.3, you will receive a Margin Call, which is a reminder that you should either increase your collateral (by depositing more funds) or reduce your loan (by repaying what you’ve borrowed).
If your margin level drops to 1.1, your assets will be automatically liquidated, meaning that Binance will sell your funds at market price to repay the loan.
Click on “Positions” to check detailed information about your current positions. If you prefer to see the values in USDT, select “USDT Benchmark” on the right side.
How to trade on margin
If you wish to use your borrowed funds to trade, you can go to the Exchange page, select the “Margin” tab, and trade normally using Limit, Market, Stop-Limit, and OCO orders.
How to repay your debt
To repay your debt, click on “Borrow/Repay” button and select the “Repay” tab.
The total amount to be paid is the sum of the total borrowed plus the interest rates. Make sure you have the required balance before proceeding.
When you are ready, select the coin and amount you wish to repay, and click “Confirm repayment.” Note that you can only use the same cryptocurrency to make the repayment.
The switch button
You will notice that the margin interface has a switch button next to your balances. This button allows you to switch between asset mode (normal orders) and margin mode (margin orders).
For example, if you hold 5 BNB in your Margin account, you can sell a total of 15 BNB.
Note that now you have the “Margin Sell BNB” button rather than the regular “Sell BNB”.
So, if you decide to “Margin Sell” 7 BNB, the system will automatically borrow 2 BNB for you (remember that your actual balance is 5 BNB).
After clicking “Margin Sell BNB,” you see the following confirmation message:
So, the Switch button allows you to quickly borrow funds when opening new positions. However, you have to repay the borrowed funds manually afterward.
Moving funds back
If you wish to move your funds back from the Margin Wallet to your regular Binance Wallet, click on “Transfer” and use the button in-between the two wallets to change the direction of the transfer. Next, select the coin and amount and click “Confirm transfer.”
You can move your funds freely from one wallet to another, without any fees. But note that if you currently have assets borrowed, your risk level will increase as the funds of your Margin Wallet decreases. If your Risk Level gets too high, there is a chance of your assets being liquidated. So make sure you understand how margin trading works before using it.
An example
Alice believes the price of BNB will go up, so she wants to open a leveraged long position on BNB. To do so, she first transfers funds to her Margin Wallet and then borrows BTC. Next, Alice uses the borrowed BTC to buy BNB.
If the price of BNB goes up as Alice expected, she can sell her assets and repay the borrowed BTC along with the corresponding interest. Any leftover for that trade will represent her profits.
However, margin trading can amplify both the gains and the losses. So if the market moves against Alice’s position, she will have bigger losses.
Margin trading is a method of trading assets using funds provided by a third party. When compared to regular trading accounts, margin accounts allow traders to access greater sums of capital, allowing them to leverage their positions. Essentially, margin trading amplifies trading results so that traders are able to realize larger profits on successful trades.
This ability to expand trading results makes margin trading especially popular in low-volatility markets, particularly the international Forex market. Still, margin trading is also used in stock, commodity, and cryptocurrency markets.
In traditional markets, the borrowed funds are usually provided by an investment broker. In cryptocurrency trading, however, funds are often provided by other traders, who earn interest based on market demand for margin funds. Although less common, some cryptocurrency exchanges also provide margin funds to their users.
How does margin trading work?
When a margin trade is initiated, the trader will be required to commit a percentage of the total order value. This initial investment is known as the margin, and it is closely related to the concept of leverage.
In other words, margin trading accounts are used to create leveraged trading, and the leverage describes the ratio of borrowed funds to the margin. For example, to open a $100,000 trade at a leverage of 10:1, a trader would need to commit $10,000 of their capital.
Naturally, different trading platforms and markets offer a distinct set of rules and leverage rates. In the stock market, for example, 2:1 is a typical ratio, while futures contracts are often traded at a 15:1 leverage. In regards to Forex brokerages, margin trades are frequently leveraged at a 50:1 ratio, but 100:1 and 200:1 are also used in some cases.
When it comes to cryptocurrency markets, the ratios are typically ranging from 2:1 to 100:1, and the trading community often uses the ‘x’ terminology (2x, 5x, 10x, 50x, and so forth).
Margin trading can be used to open both long and short positions. A long position reflects an assumption that the price of the asset will go up, while a short position reflects the opposite. While the margin position is open, the trader’s assets act as collateral for the borrowed funds.
This is critical for traders to understand, as most brokerages reserve the right to force the sale of these assets in case the market moves against their position (above or below a certain threshold).
For instance, if a trader opens a long leveraged position, they could be margin called when the price drops significantly. A margin call occurs when a trader is required to deposit more funds into their margin account in order to reach the minimum margin trading requirements. If the trader fails to do so, their holdings are automatically liquidated to cover their losses.
Typically, this occurs when the total value of all of the equities in a margin account, also known as the liquidation margin, drops below the total margin requirements of that particular exchange or broker.
Advantages and disadvantages
The most obvious advantage of margin trading is the fact that it can result in larger profits due to the greater relative value of the trading positions. Other than that, margin trading can be useful for diversification, as traders can open several positions with relatively small amounts of investment capital. Finally, having a margin account may make it easier for traders to open positions quickly without having to shift large sums of money to their accounts.
For all its upsides, margin trading does have the obvious disadvantage of increasing losses in the same way that it can increase gains. Unlike the regular spot trading, margin trading introduces the possibility of losses that exceed a trader’s initial investment and, as such, is considered a high-risk trading method. Depending on the amount of leverage involved in a trade, even a small drop in the market price may cause substantial losses for traders. For this reason, it’s important that investors who decide to utilize margin trading employ proper risk management strategies and make use of risk mitigation tools, such as stop-limit orders.
Margin trading in cryptocurrency markets
Trading on margin is inherently riskier than regular trading, but when it comes to cryptocurrencies, the risks are even higher. Owing to the high levels of volatility, typical to these markets, cryptocurrency margin traders should be especially careful. While hedging and risk management strategies may come handy, margin trading is certainly not suitable for beginners.
Being able to analyze charts, identify trends, and determine entry and exit points won’t eliminate the risks involved with margin trading, but it may help to better anticipate risks and trade more effectively. So before leveraging their cryptocurrency trades, users are recommended first to develop a keen understanding of technical analysis and to acquire an extensive spot trading experience.
Margin funding
For investors who do not have the risk tolerance to engage in margin trading themselves, there is another way to profit from the leveraged trading methods. Some trading platforms and cryptocurrency exchanges offer a feature known as margin funding, where users can commit their money to fund the margin trades of other users.
Usually, the process follows specific terms and yields dynamic interest rates. If a trader accepts the terms and takes the offer, the funds’ provider is entitled to repayment of the loan with the agreed upon interest.
Although the mechanisms may differ from exchange to exchange, the risks of providing margin funds are relatively low, owing to the fact that leveraged positions can be forcibly liquidated to prevent excessive losses. Still, margin funding requires users to keep their funds in the exchange wallet. So, it is important to consider the risks involved and to understand how the feature works on their exchange of choice.
Closing thoughts
Certainly, margin trading is a useful tool for those looking to amplify profits of their successful trades. If used properly, the leveraged trading provided by margin accounts can aid in both profitability and portfolio diversification.
As mentioned, however, this method of trading can also amplify losses and involves much higher risks. So, it should only be used by highly skilled traders. As it relates to cryptocurrency, margin trading should be approached even more carefully due to the high levels of market volatility.
Essentially, forward and futures contracts are agreements that allow traders, investors, and commodity producers to speculate on the future price of an asset. These contracts function as a two-party commitment that enables the trading of an instrument on a future date (expiration date), at a price agreed upon at the moment the contract is created.
The underlying financial instrument of a forward or futures contract can be any asset, such as equity, a commodity, a currency, an interest payment or even a bond.
However, unlike forward contracts, the futures contracts are standardized from a contract perspective (as legal agreements) and are traded on specific venues (futures contracts exchanges). Therefore, futures contracts are subject to a particular set of rules, which may include, for instance, the size of the contracts and the daily interest rates. In many cases, the execution of futures contracts is guaranteed by a clearing house, making it possible for parties to trade with reduced counterparty risks.
Although primitive forms of futures markets were created in Europe during the 17th century, the Dōjima Rice Exchange (Japan) is regarded as the first futures exchange to be established. In early 18th-century Japan, most payments were made in rice, so futures contracts started to be used as a way to hedge against the risks associated with unstable rice prices.
With the emergence of electronic trading systems, the popularity of futures contracts, along with a range of use-cases, became widespread across the entire financial industry.
Functions of futures contracts
Within the financial industry context, futures contracts typically serve some of the following functions:
Hedging and risk management: futures contracts can be utilized to mitigate against a specific risk. For example, a farmer may sell futures contracts for their products to ensure they get a certain price in the future, despite unfavorable events and market fluctuations. Or a Japanese investor that owns US Treasury bonds may buy JPYUSD futures contracts for the amount equal to the quarterly coupon payment (interest rates) as a way to lock the value of the coupon in JPY at a predefined rate and, thus, hedging his USD exposure.
Leverage: futures contracts allow investors to create leveraged positions. As contracts are settled at the expiration date, investors are able to leverage their position. For example, a 3:1 leverage allows traders to enter into a position three times larger than their trading account balance.
Short exposure: futures contracts allow investors to take a short exposure to an asset. When an investor decides to sell futures contracts without owning the underlying asset, it is commonly referred to as a “naked position”.
Asset variety: investors are able to take exposure to assets that are difficult to be traded on the spot. Commodities such as oil are typically costly to deliver and involve high storage expenses, but through the use of futures contracts, investors and traders can speculate on a wider variety of asset classes without having to physically trade them.
Price discovery: futures markets are a one-stop-shop for sellers and buyers (i.e. supply and demand meet) for several asset classes, such as commodities. For example, the price of oil can be determined in relation to real-time demand on futures markets rather than through local interaction at a gas station.
Settlement mechanisms
The expiration date of a futures contract is the last day of trading activities for that particular contract. After that, trading is halted and the contracts are settled. There are two main mechanisms for futures contracts settlement:
Physical settlement: the underlying asset is exchanged between the two parties that agreed on a contract at a predefined price. The party that was short (sold) has the obligation to deliver the asset to the party that was long (bought).
Cash settlement: the underlying asset is not exchanged directly. Instead, one party pays the other an amount that reflects the current asset value. One typical example of a cash-settled futures contract is an oil futures contract, where cash is exchanged rather than oil barrels as it would be fairly complicated to physically trade thousands of barrels.
Cash-settled futures contracts are more convenient and, therefore, more popular than physical-settled contracts, even for liquid financial securities or fixed-income instruments whose ownership can be transferred fairly quickly (at least comparing to physical assets like barrels of oil).
However, cash-settled futures contracts may lead to manipulation of the underlying asset price. This type of market manipulation is commonly referred to as “banging the close” – which is a term that describes abnormal trading activities that intentionally disrupt orders books when the futures contracts are getting close to their expiration date.
Exit strategies for futures contracts
After taking a futures contract position, there are three main actions that futures traders can perform: Offsetting: refers to the act of closing a futures contract position by creating an opposite transaction of the same value. So, if a trader is short 50 futures contracts, they can open a long position of equal size, neutralizing their initial position. The offsetting strategy allows traders to realize their profits or losses prior to the settlement date.
Rollover: occurs when a trader decides to open a new futures contract position after offsetting their initial one, essentially extending the expiration date. For instance, if a trader is long on 30 futures contracts that expire in the first week January, but they want to prolong their position for six months, they can offset the initial position and open a new one of the same size, with the expiration date set to the first week of July.
Settlement: if a futures trader does not offset or rollover their position, the contract will be settled at the expiration date. At this point, the involved parties are legally obligated to exchange their assets (or cash) according to their position.
Futures contracts price patterns: contango and normal backwardation
From the moment futures contracts are created until their settlement, the contracts market price will be constantly changing as a response to buying and selling forces.
The relation between the maturity and varying prices of the futures contracts generate different price patterns, which are commonly referred to as contango (1) and normal backwardation (3). These price patterns are directly related to the expected spot price (2) of an asset at the expiration date (4), as illustrated below.
Contango (1): a market condition where the price of a futures contract is higher than the expected future spot price.
Expected spot price (2): anticipated asset price at the moment of settlement (expiration date). Note that the expected spot price is not always constant, i.e., it may change in response to market supply and demand.
Normal backwardation (3): a market condition where the price of futures contracts is lower than the expected future spot price.
Expiration date (4): the last day of trading activities for a particular futures contract, before settlement occurs.
While contango market conditions tend to be more favorable for sellers (short positions) than buyers (long positions), normal backwardation markets are usually more beneficial for buyers.
As it gets closer to the expiration date, the futures contract price is expected to gradually converge to the spot price until they eventually have the same value. If the futures contract and spot price are not the same at the expiration date, traders will be able to make quick profits from arbitrage opportunities.
In a contango scenario, futures contracts are traded above the expected spot price, usually for convenience reasons. For instance, a futures trader may decide to pay a premium for physical commodities that will be delivered in a future date, so they don’t need to worry about paying for expenses such as storage and insurance (gold is a popular example). Additionally, companies may use futures contracts to lock their future expenses on predictable values, buying commodities that are indispensable for their service (e.g., bread producer buying wheat futures contracts).
On the other hand, a normal backwardation market takes place when futures contracts are traded below the expected spot price. Speculators buy futures contracts hoping to make a profit if the price goes up as expected. For example, a futures trader may buy oil barrels contracts for $30 each today, while the expected spot price is $45 for the next year.
Closing thoughts
As a standardized type of forward contract, futures contracts are among the most used tools within the financial industry and their various functionalities make them suitable for a wide range of use cases. Still, it is important to have a good understanding of the underlying mechanisms of futures contracts and their particular markets before investing funds.
While “locking” an asset’s price in the future is useful in certain circumstances, it is not always safe – especially when the contracts are traded on margin. Therefore, risk management strategies are often employed to mitigate the inevitable risks associated with futures contracts trading. Some speculators also use technical analysis indicators along with fundamental analysis methods as a way to get insights into the price action of futures markets.
The Moving Average Convergence Divergence (MACD) is an oscillator-type indicator that is widely used by traders for technical analysis (TA). MACD is a trend-following tool that utilizes moving averages to determine the momentum of a stock, cryptocurrency, or another tradeable asset.
Developed by Gerald Appel in the late 1970s, the Moving Average Convergence Divergence indicator tracks pricing events that have already occurred and, thus, falls into the category of lagging indicators (which provide signals based on past price action or data). The MACD may be useful for measuring market momentum and possible price trends and is utilized by many traders to spot potential entry and exit points.
Before diving into the mechanisms of MACD, it is important to understand the concept of moving averages. A moving average (MA) is simply a line that represents the average value of previous data during a predefined period. In the context of financial markets, moving averages are among the most popular indicators for technical analysis (TA) and they can be divided into two different types:
simple moving averages (SMAs) and exponential moving averages (EMAs). While the SMAs weight all data inputs equally, EMAs assign more importance to the most recent data values (newer price points).
How MACD works
The MACD indicator is generated by subtracting two exponential moving averages (EMAs) to create the main line (MACD line), which is then used to calculate another EMA that represents the signal line.
In addition, there is the MACD histogram, which is calculated based on the differences between those two lines. The histogram, along with the other two lines, fluctuates above and below a centerline, which is also known as the zero line.
Therefore, the MACD indicator consists of three elements moving around the zero line:
The MACD line (1): helps determine upward or downward momentum (market trend). It is calculated by subtracting two exponential moving averages (EMA).
The signal line (2): an EMA of the MACD line (usually 9-period EMA). The combined analysis of the signal line with the MACD line may be helpful in spotting potential reversals or entry and exit points.
Histogram (3): a graphical representation of the divergence and convergence of the MACD line and the signal line. In other words, the histogram is calculated based on the differences between the two lines.
The MACD line
In general, the exponential moving averages are measured according to the closing prices of an asset, and the periods used to calculate the two EMAs are usually set as 12 periods (faster) and 26 periods (slower). The period may be configured in different ways (minutes, hours, days, weeks, months), but this article will focus on daily settings. Still, the MACD indicator may be customized to accommodate different trading strategies.
Assuming the standard time ranges, the MACD line itself is calculated by subtracting the 26-day EMA from the 12-day EMA.MACD line = 12d EMA – 26d EMA
As mentioned, the MACD line oscillates above and below the zero line, and this is what signals the centerline crossovers, telling traders when the 12-day and 26-day EMA are changing their relative position.
The signal line
By default, the signal line is calculated from a 9-day EMA of the main line and, as such, provides further insights into its previous movements.Signal line = 9d EMA of MACD line
Although they are not always accurate, when the MACD line and signal line cross, these events are usually deemed as trend reversal signals, especially when they happen at the extremities of the MACD chart (far above or far below the zero line).
The MACD histogram
The histogram is nothing more than a visual record of the relative movements of the MACD line and the signal line. It is simply calculated by subtracting one from the other:MACD histogram = MACD line – signal line
However, instead of adding a third moving line, the histogram is made of a bar graph, making it visually easier to read and interpret. Note that the histogram bars have nothing to do with the trading volume of the asset.
MACD settings
As discussed, the default settings for MACD is based on the 12, 26, and 9-period EMAs – hence MACD (12, 26, 9). However, some technical analysists and chartists change the periods as a way to create a more sensitive indicator. For example, MACD (5, 35, 5) is one that is often used in traditional financial markets along with longer timeframes, such as weekly or monthly charts.
It is worth noting that due to the high volatility of cryptocurrency markets, increasing the sensitivity of the MACD indicator may be risky because it will likely result in more false signals and misleading information.
How to read MACD charts
As the name suggests, the Moving Average Convergence Divergence indicator tracks the relationships between moving averages, and the correlation between the two lines can be described as either convergent or divergent. Convergent when the lines gravitate toward one another and divergent when they move apart.
Still, the relevant signals of the MACD indicator are related to the so-called crossovers, which happen when the MACD line crosses above or below the centerline (centerline crossovers), or above or below the signal line (signal line crossovers).
Keep in mind that both centerline and signal line crossovers may happen multiple times, producing many false and tricky signals – especially in regards to volatile assets, such as cryptocurrencies. Therefore, one should not rely on the MACD indicator alone.
Centerline crossovers
Centerline crossovers happen when the MACD line moves either on the positive or negative area. When it crosses above the centerline, the positive MACD value indicates that the 12-day EMA is greater than the 26-day. In contrast, a negative MACD is shown when the MACD line crosses below the centerline, meaning that the 26-day average is higher than the 12-day. In other terms, a positive MACD line suggests a stronger upside momentum, while a negative one may indicate a stronger drive to the downside.
Signal line crossover
When the MACD line crosses above the signal line, traders often interpret it as a potential buying opportunity (entry point). On the other hand, when the MACD line crosses below the signal line, traders tend to consider it a selling opportunity (exit point).
While the signal crossovers can be helpful, they are not always reliable. It is also worth considering where they take place in the chart as a way to minimize the risks. For instance, if the crossover calls for a buy but the MACD line indicator is below the centerline (negative), market conditions may still be considered bearish. Conversely, if a signal line crossover indicates a potential selling point, but the MACD line indicator is positive (above the zero line), market conditions are still likely to be bullish. In such a scenario, following the sell signal may carry more risk (considering the larger trend).
MACD and price divergences
Along with centerline and signal line crossovers, MACD charts may also provide insights through divergences between the MACD chart and the asset’s price action.
For example, if the price action of a cryptocurrency makes a higher high while the MACD creates a lower high, we would have a bearish divergence, indicating that despite the price increase, the upside momentum (buying pressure) is not as strong as it was. Bearish divergences are usually interpreted as selling opportunities because they tend to precede price reversals.
On the contrary, if the MACD line forms two rising lows that align with two falling lows on the asset price, then this is considered a bullish divergence, suggesting that despite the price decrease the buying pressure is stronger. Bullish divergences tend to precede price reversals, potentially indicating a short-term bottom (from a downtrend to an uptrend).
Closing thoughts
When it comes to technical analysis, the Moving Average Convergence Divergence oscillator is one of the most useful tools available. Not only because it is relatively easy to use, but also because it is quite effective at identifying both market trends and market momentum.
As most TA indicators, however, the MACD is not always accurate and may provide numerous false and misleading signals – especially in relation to volatile assets or during weak-trending or sideways price action. Consequently, many traders use MACD with other indicators – such as the RSI indicator – to reduce risks and to further confirm the signals.
In 2008, the financial crisis shook the global economy. Now ten years later, people are wondering how the rules have changed, and more importantly, how this type of economic crisis can be avoided in the future.
What began as a crisis in regards to the subprime mortgage market, later developed into a large-scale, global financial crisis and recession. From massive bailouts to the resulting economic downturn, many are now questioning the stability and transparency of the global banking systems they previously trusted.
What happened during the financial crisis?
Referred to as the worst economic disaster since the Great Depression, the 2008 financial crisis devastated the world economy. This resulted in what’s known as the Great Recession, which led to falling housing prices and sharp increases in unemployment. The associated repercussions were enormous, and are still influencing financial systems today.
In the US, more than eight million citizens lost their jobs, approximately 2.5 million businesses were devastated, and close to four million homes were foreclosed in less than two years. From food insecurity to income inequality, many have lost faith in the system.
The recession officially ended in 2009, but many continued to suffer long after it, especially in the US. The unemployment rate reached 10% in 2009 and was only recovered to pre-crisis levels in 2016.
What caused the Great Recession?
In terms of the cause, numerous factors were to blame. The “perfect storm” was brewing and once it reached its breaking point, a financial crisis ensued. Financial institutions were giving out high-risk loans (mainly mortgages) that eventually resulted in a massive taxpayer-financed bailout.
The true cause of the 2008 financial crisis is highly complex, but it was America’s housing market that initiated a chain reaction – one that would expose cracks in the financial system. This was followed by the bankruptcy of the Lehman Brothers firm which had a crippling effect on the American and European economy.
In turn, the episode made the public aware of the banks’ potential shortcomings. It also caused significant disruptions around the world, based on how the global economy is interconnected.
Why does it matter today?
Although it has been a decade since the financial crisis hit, there are still concerns. The effects of this recession are still alive, and the global economic recovery has been fairly weak in comparison to historical standards. High-risk loans are being offered once again, and although default rates are low today, that could change very quickly.
Regulators insist that the global financial system has been altered since 2008 and that safety measures have been considerably enhanced. For this reason, many believe that the global financial system is stronger today than it was a decade ago.
On the other hand, some are still wondering: could this type of economic crisis happen again? The short answer is yes, anything is possible. Despite the many changes that were made and the new rules that were enforced, there are fundamental problems that remain.
Noteworthy, the 2008 financial crisis reminds us that policy matters. The events that took place in 2008 were essentially caused by the decisions that regulators, politicians, and policymakers made years prior. From poorly controlled regulatory bodies to the impact of corporate culture, the Great Recession is anything but “in the past.”
The development of Bitcoin and other cryptocurrencies
While the rise of a financial crisis in 2008 highlighted some of the risks associated with the traditional banking system, 2008 was also the birth year of Bitcoin – the first cryptocurrency to be created.
In contrast to fiat currencies, such as the US dollar or British pound, Bitcoin and other cryptocurrencies are decentralized, which means they are not controlled by a national government or central bank. Instead, the creation of new coins is determined by a predefined set of rules (protocol).
The Bitcoin protocol and its underlying Proof of Work consensus algorithm ensure that the issuance of new cryptocurrency units follows a regular schedule. More specifically, the generation of new coins is reliant on a process known as mining. The miners are not only responsible for introducing new coins into the system but also for securing the network by verifying and validating transactions.
In addition, the protocol establishes a fixed max supply that guarantees there will only ever be a total of 21 million Bitcoins in the world. This means that there are no surprises when it comes to the current and future supply of Bitcoin. Moreover, the Bitcoin source code is open-source, so anyone is able to not only check it but also to contribute and participate in its development.
Closing thoughts
Although it has been a decade since the 2008 financial crisis, people have not forgotten how fragile the international banking system really is. We cannot be totally sure, but this is probably one of the reasons that led to the creation of a decentralized digital currency like Bitcoin.
Cryptocurrencies still have a long way to go, but they definitely represent a viable alternative for the traditional fiat system. Such an alternative economic network may bring financial independence where there is none, and certainly has the potential to create a better society going forward.
Stochastic RSI, or simply StochRSI, is a technical analysis indicator used to determine whether an asset is overbought or oversold, as well as to identify current market trends. As the name suggests, the StochRSI is a derivative of the standard Relative Strength Index (RSI) and, as such, is considered an indicator of an indicator. It is a type of oscillator, meaning that it fluctuates above and below a center line.
The StochRSI was first described in the 1994 book titled The New Technical Trader by Stanley Kroll and Tushar Chande. It is frequently used by stock traders, but may also be applied to other trading contexts, such as Forex and cryptocurrency markets.
How does StochRSI work?
The StochRSI indicator is generated from the ordinary RSI by applying the Stochastic Oscillator formula. The result is a single numerical rating that swings around a centerline (0.5), within a 0-1 range. However, there are modified versions of the StochRSI indicator that multiply the results by 100, so the values range between 0 and 100 instead of 0 and 1. It is also common to see a 3-day simple moving average (SMA) along with the StochRSI line, which acts as a signal line and is meant to reduce the risks of trading on false signals.
The standard Stochastic Oscillator formula considers an asset’s closing price along with its highest and lowest points within a set period. However, when the formula is used to calculate the StochRSI, it is directly applied to the RSI data (prices are not considered).Stoch RSI = (Current RSI – Lowest RSI)/(Highest RSI – Lowest RSI)
Just like the standard RSI, the most common time setting used for the StochRSI is 14 periods. The 14 periods involved in the StochRSI calculation are based on the chart time frame. So, while a daily chart would consider the past 14 days (candlesticks), an hourly chart would generate the StochRSI based on the last 14 hours.
The periods could be set to days, hours or even minutes, and their use varies significantly from trader to trader (according to their profile and strategy). The number of periods can also be adjusted up or down to identify longer-term or shorter-term trends. A 20-period setting is another fairly popular option for the StochRSI indicator.
As mentioned, some StochRSI charting patterns assign values ranging from 0 to 100 instead of 0 to 1. On these charts, the centerline is at 50 instead of 0.5. Therefore, the overbought signal that usually occurs at 0.8 would be denoted at 80, and the oversold signal at 20 rather than 0.2. Charts with a 0-100 setting may look slightly different, but the practical interpretation is essentially the same.
How to use StochRSI?
The StochRSI indicator takes on its greatest significance near the upper and lower bounds of its range. Therefore, the primary use of the indicator is to identify potential entry and exit points, as well as price reversals. So, a reading of 0.2 or below indicates that an asset is probably oversold, while a reading of 0.8 or above suggests that it is likely to be overbought.
In addition, readings that are closer to the centerline can also provide useful information in regards to market trends. For instance, when the centerline acts as a support and the StochRSI lines move steadily above the 0.5 mark, it may suggest the continuation of a bullish or upward trend – especially if the lines start to move toward 0.8. Likewise, readings consistently below 0.5 and trending toward 0.2 indicate a downward or bearish trend.
StochRSI vs. RSI
Both StochRSI and RSI are banded oscillator indicators that make it easier for traders to identify potential overbought and oversold conditions, as well as possible reversal points. In short, the standard RSI is a metric used to track how quickly and to what degree the prices of an asset change in relation to a set time frame (period).
However, when compared to the Stochastic RSI, the standard RSI is a relatively slow-moving indicator that produces a small number of trading signals. The application of the Stochastic Oscillator formula to the regular RSI allowed the creation of the StochRSI as an indicator with increased sensitivity. Consequently, the number of signals it produces is much higher, giving traders more opportunities to identify market trends and potential buying or selling points.
In other words, the StochRSI is a fairly volatile indicator, and while this makes it a more sensitive TA tool that can help traders with an increased number of trading signals, it is also riskier because it often generates a fair amount of noise (false signals). As mentioned, applying simple moving averages (SMA) is one common method for reducing the risks associated with these false signals and, in many cases, a 3-day SMA is already included as a default setting for the StochRSI indicator.
Closing thoughts
Because of its greater speed and sensitivity to market movements, the Stochastic RSI can be a very useful indicator for analysts, traders, and investors – for both short-term and long-term analysis. However, more signals also mean more risk and, for this reason, the StochRSI should be used alongside other technical analysis tools that may help to confirm the signals it creates. It is also important to keep in mind that the cryptocurrency markets are more volatile than the traditional ones and, as such, may generate an increased number of false signals.