The Borderless State of DeFi
Will innovation and growth within DeFi continue to expand beyond the scope of the crypto-industry?
Binance Research (Etienne), in collaboration with the team of DApp.Review
January 8th 2020 (updated on January 22th)
DeFi has become one of the critical growth areas for Ethereum since 2019. Other competing blockchains are also building DeFi products, yet at a much slower pace.
Ethereum-based DeFi’s user-side remains small, with an average number of more than 40,000 monthly users, and 90% of these users are using decentralized exchanges.
Meanwhile, the number of active projects, i.e., with more than 50 daily users, nearly doubled in 2019, while a growing pool of developers has been building new products and establishing new services.
Since its beginning, the DeFi space has been traditionally dominated by SAI/DAI, the decentralized stablecoin minted in the MakerDAO ecosystem, which released its MCD (Multi-Collateral Dai) in November 2019.
Since then, its migration from SAI to DAI has been occurring at a fast pace, with an estimated 64% of the supply being converted (as of December 31st).
The incorporation of USDC into multiple DeFi platforms has challenged DAI, owing to reasons such as its more abundant supply, different interest rate dynamics, and greater peg-price stability.
Lending platforms like Compound have increasingly challenged the dominance of Maker, measured by the total collateral value locked in DeFi, which currently stands at ~50% (vs. more than 90% in early 2019).
Decentralized exchanges “2.0” also picked up in volume. Uniswap was used by more than 19K users, exhibiting a total annual volume of $390 million. Similarly, Kyber was used by more than 35K users and displayed a yearly volume of $387 million.
In 2020, we expect new developments on Ethereum-based DeFi (e.g., derivatives, undercollateralized initiatives, the inclusion of ERC-20 USDT), staking to become a fundamental building block of DeFi, and Alt-DeFi to gain momentum owing to reasons such as more prominent cross-chain interoperability solutions.
DeFi (Decentralized Finance) has become one of the most significant areas for Ethereum, with more than 100 projects and teams building applications and protocols in 2019.
Binance Research started in June a series of reports focusing on Decentralized Finance (“DeFi Series”); this third report discusses recent developments and critical narratives in the DeFi space, focusing mostly on Ethereum, though other blockchains are also considered.
Most of the data used in this report are provided by DApp.Review, one of the new members in the Binance ecosystem.

Please read DAppReview’s annual overview of the state of DApps, which includes high-quality insights about all decentralized application fields such as Game, Social, and Casino.
1. The growing importance of DeFi in Ethereum
As illustrated in our report about the world of tokenization, Ethereum’s spectrum of applications is more extensive than other blockchains. However, its primary focus has shifted to exchange and financial applications1, as discussed in our previous report about Ethereum-based DeFi.

DeFi includes (decentralized) exchange services and financial applications like borrowing and lending markets, asset management services, and payment solutions.
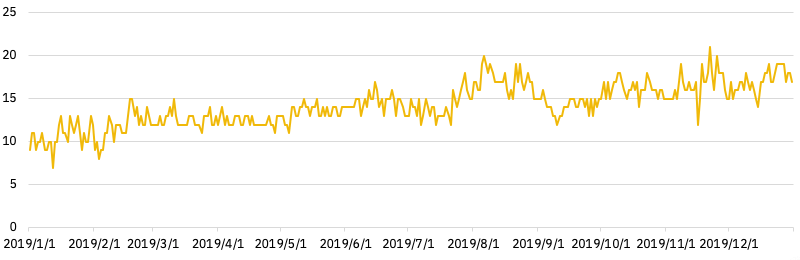
Chart 1 – Price of Ether (ETH) in USD in 2019

Sources: Binance Research, CoinMarketCap.
In 2019, the price of Ether fluctuated within a $100-$350 range, with a median price of $173.
Regardless of its price, most of the decentralized financial ecosystem is, so far, being built on Ethereum.
Chart 2 – Monthly unique users in Ethereum DeFi in 2019
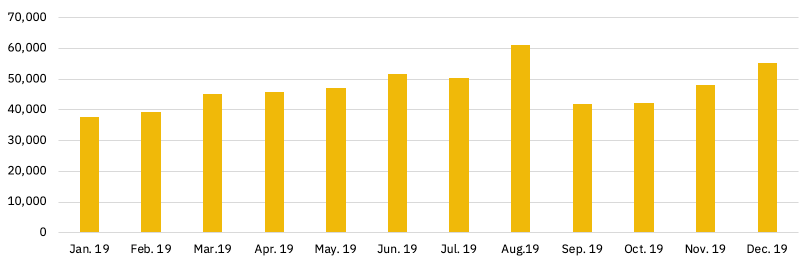
Sources: DApp Review, Binance Research.
In 2019, the monthly number of unique DeFi users ranged between 40,000 and 60,000.
However, there was a significant difference between the user counts for financial applications (e.g., lending platforms) and exchange services (i.e., token-to-token trading platforms).
Chart 3 – Monthly unique users in Ethereum DeFi: Exchange vs. Finance in 2019
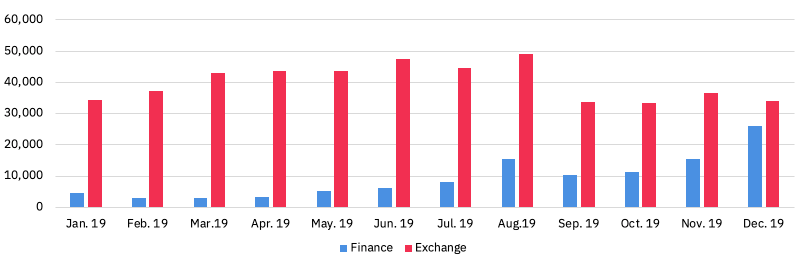
Sources: DApp Review, Binance Research.
The number of monthly unique users was 34,244 users for decentralized exchanges and 4,649 for financial applications in January 20192.
Over 2019, the number of users for DEXs increased and peaked at 48,934 in August 2019, before dropping back close to its initial level, with 34,033 users recorded in December.
On the other hand, the number of users for financial applications has kept increasing since January. In August, it broke 10k monthly users and, in December, a total number of 25,925 single users were recorded using decentralized financial applications on Ethereum.
Chart 4 – DeFi on-chain activities relative to the Ethereum DApp industry based on USD volume

Sources: DApp Review, Binance Research.
This chart represents all on-chain activities, which may include some exchanges that are not fully-decentralized (e.g., IDEX).
As illustrated by the above chart, more than 90% of all on-chain volume for Ethereum-based DApps come from DeFi-related applications: DeFi has been the growth gist of Ethereum in 2019, from the perspective of users.
In short, Ethereum and DeFi have become a two-headed monster, each leading the growth of further development in the other. The main characteristics of their interplay are defined in the next section.
2. Exploring the inners of Ethereum DeFi
As depicted in Table 1, the total number of single users per platform varied greatly in 2019.
Table 1 – Count of single users in 2019 per platform
PLATFORM
NUMBER OF USERS
Kyber 35,570, Compound 21,424, Uniswap 19,161, MakerDAO 17,994, Synthetix 10,741, dYdX 3,694, Oasis 3,101, Nuo Network 3,007, Fulcrum 853,
Sources: DApp Review, Binance Research.
Kyber was the most used project in DeFi, with a total of 35,570 unique users in 2019.
Compound was the second most popular project in DeFi and the leader in the “finance” sub-category.
However, these figures do not necessarily illustrate the overall use of some underlying assets powered by some of these protocols. For instance, DAI could be used (e.g., trading, payment) without interacting with MakerDAO smart contracts. Similarly, cTokens (Compound) and iTokens & pTokens (Fulcrum) can be exchanged outside of the designed protocol. As more of these tokens circulate, a statistic to watch closely is their average daily transactions and the number of active addresses holding them.
2.1 USDC: DAI’s nemesis
At the cornerstone of DeFi, DAI, the decentralized stablecoin minted in the MakerDAO protocol, has historically been at the heart of DeFi.
However, in 2019, USD Coin (USDC), the fiat collateralized stablecoin issued by Centre consortium, became its nemesis.
Chart 5 – Evolution of USDC and SAI/DAI supply in 2019
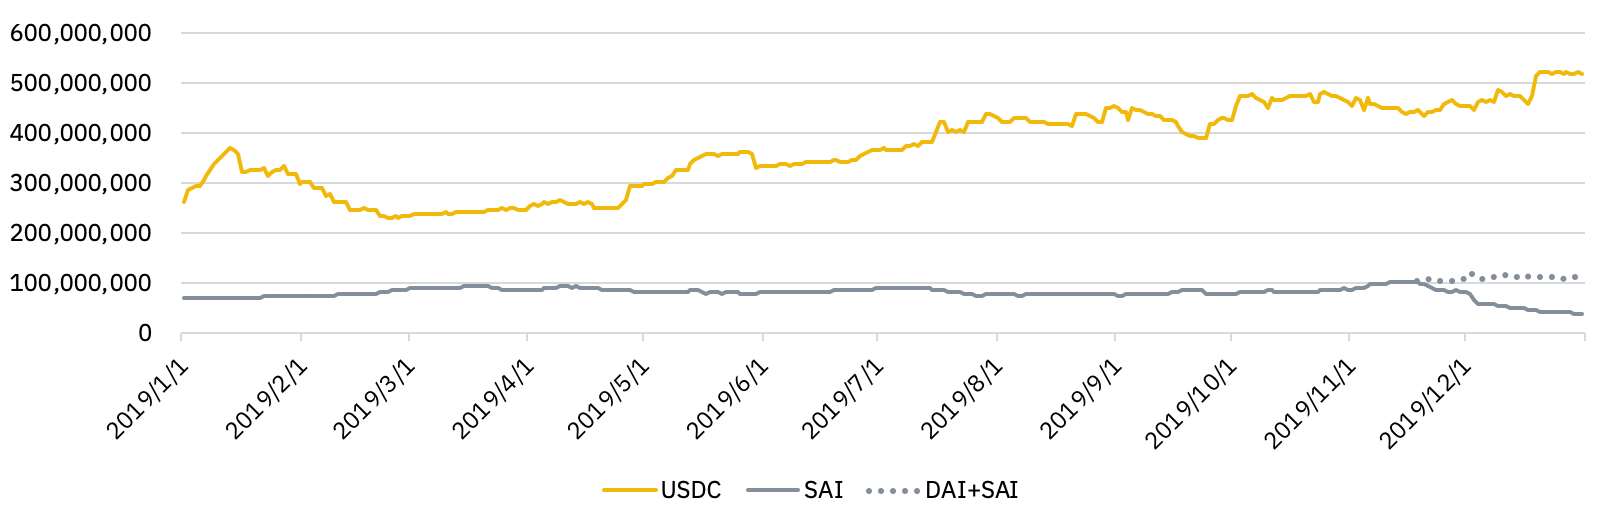
Sources: Binance Research, Etherscan.
As illustrated in chart 5, the gap in total supply between USDC and DAI accelerated in 2019, partly due to single-collateral DAI being restrained by a 100 million supply cap (acting as a debt ceiling for the Maker ecosystem). However, the protocol voted an increase to the supply cap only in November, raising it to 120 million. The supply cap increase was the first since 2018 when the ceiling was raised from 50 million up to the 100 million mark.
Meanwhile, USDC supply grew from 261.3 million to 518.5 million during 2019, an increase of +98.4%. In comparison, the aggregated SAI+DAI supply increased only +60.4% YoY, from 69.6 million to 111.6 million.
Chart 6 – Breakdown of DAI/SAI as of December 31st 2019

Sources: Binance Research, Etherscan.
Mirroring the growth of the total market cap of USDC, the use of USDC as collateral also steadily increased in 2019.
More than 30 million of USDC has been supplied to the Compound protocol alone, representing more than 25% of the value of all DAI/SAI in circulation, as of December 31st.
Chart 7 – Evolution of the total USDC locked in Compound

Sources: Binance Research, Compound.
Compound added support for USDC on May 23rd. The number of USDC provided to the protocol rapidly increased through September, where the total amount deposited reached above 30 million USDC. Since then, it has remained around this level.
However, its larger total supply may not necessarily be the only reason for the growing popularity of USDC in the DeFi world.
USDC also displayed greater price stability than DAI in 2019, as illustrated in the chart below.
Chart 8 – Daily close prices of SAI and USDC in 2019

Sources: Binance Research, CoinMarketCap.
Finally, minting DAI entails a variable borrowing cost (paid by the stability fee to MKR holders), while minting USDC does not require more than minor negligible fees (from Centre). The stability fee is discussed in-depth in subsection 2.3.
2.2 MakerDAO challenged by the multi-digit growth in Compound and Synthetix
As the supply of DAI kept increasing (see subsection 2.1), Maker itself also displayed a net positive growth in the value of its collateral.
Chart 9 – Evolution of the total value of the collateral in MakerDAO (in USD)

Sources: Binance Research, MKR.Tools.
The total value of the collateral in MakerDAO increased in the first half of 2019, owing to the respective rise of the price of ETH. Similarly, it decreased in the second half of 2019. However, more ETHs were added to the platform, and the supply of SAI (and then SAI +DAI) also increased. As a result, in 2019, the total value of the collateral in MakerDAO increased from $249 million to $342 million, an increase of +37%. Meanwhile, in 2019, the price of ETH dropped by -2%.
Yet, despite the growth of the total collateral locked in MakerDAO, its “DeFi dominance” decreased in 2019, from ~90% in January 2019 to less than 50% in December.
Chart 10 – Historical dominance of MakerDAO (by the value of the collateral locked in USD)

Sources: DApp Review, Binance Research.
Chart 11 – Evolution of the value of the total collateral in Compound (in USD)

Sources: DApp Review, Binance Research.
The USD denominated value of collateral in Compound grew from $13.4 million at the beginning of the year to $104.7 million at the end of the year. This represents an annual increase of +678%.
Chart 12 – Evolution of the value of the total collateral in Synthetix (in USD)

Sources: DApp Review, Binance Research.
Even more impressively, Synthetix’s total collateral value moved from $1.6 million on March 1st to more than $160 million (EOY), owing to the meteoric increase in SNX price, the Synthetic Network token.
So far, the main asset minted in the Synthetic ecosystem has been sUSD (Synthetic USD), which is mostly backed by SNX tokens. As of December 31st, it had a supply of ~11 million units.
However, SNX is not as liquid (based on orderbook data) as cryptoassets like BAT and ETH, the two eligible collateral assets in the MakerDAO ecosystem. Hence, it remains to be seen how the system would behave with high volatility in the price of SNX.
Nevertheless, the total collateral value in other small DeFi platforms also increased dramatically in 2019 despite the price of ETH lagging in fiat terms (see chart 1).
We used the examples of Fulcrum, and Nuo Network to illustrate the overall yearly trend.
Chart 13 – Evolution of the value of the total collateral in Fulcrum/bZx (in USD)

Sources: DApp Review, Binance Research.
bZx displayed moderate yet steady growth in the total value of the collateral locked on the platform. Only starting in June 2019 with no dedicated collateral, the value of its collateral quickly increased to well over $4 million in only seven months.
Chart 14 – Evolution of the value of the total collateral in Nuo Network (in USD)

Sources: DApp Review, Binance Research.
Nuo Network, a margin trading decentralized platform, experienced rapid growth in its total collateral in its first six months, with peaks above 17 million in July and August. Since then, its total collateral locked has steadily decreased, partially owing to the decrease in the price of the locked assets.
2.3 High volatility and spreads in DeFi interest rate markets
According to the table below, interest rates vary significantly amongst assets. For instance, 0x token (ZRX), Augur (REP), and Ethereum (ETH) displayed the lowest annual average lending rates. Conversely, only ETH and REP exhibited the lowest borrowing rates (2.20% and 2.12%) as the spread is much higher for ZRX. Stablecoins like DAI and USDC displayed the largest borrowing and lending rates.
The covered interest rate parity approach indicates that ETH and other cryptoassets might be undervalued.
On the other hand, it may sometimes be cheaper to execute specific trading strategies for ETH and BTC (through WBTC) than on many centralized exchanges (e.g., Binance).
However, liquidity (depth of the books, volumes) on centralized exchanges remains much higher than on decentralized exchanges.
Chart 15 – USDC borrowing interest rates (%) from June 2019 to December 2019

Sources: Binance Research, LoanScan.
Borrowing interest rates on USDC have declined since June 2019. While dYdX rates fluctuated in greater terms, its borrowing rate on USDC has almost always been considerably lower than the borrowing rate on Compound.
Chart 16 – USDC lending interest rates (%) from June 2019 to December 2019

Sources: Binance Research, LoanScan.
Lending interest rates on USDC have steadily and slowly declined since June 2019. While the spread between Compound and dYdX is much lower than for the borrowing rate, the dYdX USDC lending rate displayed, once again, higher volatility than Compound’s.
Chart 17 – SAI borrowing rates and SAI stability fee (%) until November 18, 2019

Sources: Binance Research, LoanScan.
The stability fee set by MakerDAO governance mostly stayed above the market borrowing rate on Compound and dYdX, with Compound’s borrow rates consistently below the stability fee until the middle of September.
Meanwhile, dYdX exhibited higher spikes in borrowing rates due to a more sensitive rate formula.
This stability fee premium can be explained in a number of ways. Firstly, stability fee rates are up for a vote on a periodic basis (every weekly governance vote), whereas interest rates on Compound and dYdX are always live and reflect real-time market dynamics. As a result, users must price in the volatility that they may face on open lending pools. In addition, as more smart contract insurance platforms like Nexus Mutual and derivatives protocols like UMA Protocol develop, users may have more options to price in this risk in the future accurately.
However, as the launch of the Multi-Collateral DAI (MCD) approached, the stability fee quickly dipped below the open rates on Compound and dYdX.
Chart 18 – SAI lending rates (%) until November 18, 2019

Sources: Binance Research, LoanScan.
Furthermore, there has been an arbitrage opportunity, in a similar vein to the ones described in our previous report. Specifically, ETH coin-holders can borrow DAI from dYdX and park it to earn the Dai Savings Rate (e.g., through Oasis), which has been higher than the borrowing rate.
Chart 19 – DAI savings rate and dYdX DAI borrowing rate since November 2019

Sources: Binance Research, LoanScan.
While DeFi increased in scope, its market size remains small, and as a result, DeFi interest rate dynamics are highly dependent on platform-specific factors (e.g., different lending and borrowing market environment, fee structure, etc.).
2.4 The growth of “2.0 decentralized exchanges”
In 2019, many decentralized exchanges displayed fast growth in daily volumes.
Chart 20 – Daily trading volume of Kyber (in USD)
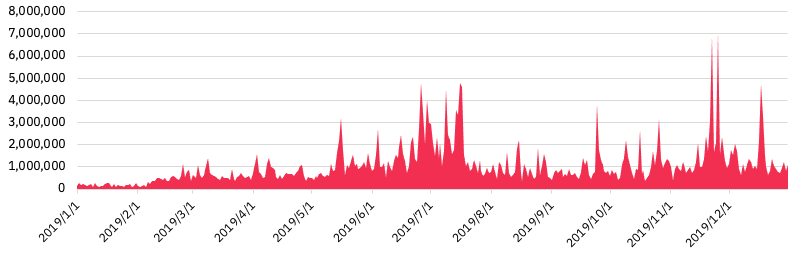
Sources: Binance Research, Kyber.
Kyber saw its volume picking up over 2019, with peaks in June-July and in late November (up to daily volume spikes of $7 million).
Meanwhile, it also experienced rapid growth in the value of its total collateral locked. As of January 1st 2019, it was worth around half a million USD. At the end of 2019, the total value locked in Kyber was worth ~$3.4 million.
Chart 21 – Aggregated daily trading volume of 0xProtocol-based DEXs (in USD)

Sources: Binance Research, 0XTracker.
0XProtocol-DEX notably includes Raday Relay, DDEX, imToken (ex-TokenIon), Paradex, and DeversiFi3. The aggregated trading volume of 0XProtocol-based DEXs has been growing since the beginning of 2019. In 2019, they displayed an aggregated average daily volume of $702k.
Chart 22 – Daily trading volume of Uniswap in 2019 (in USD)

Sources: Binance Research, DApp Review.
Uniswap also experienced impressive growth in the value of its total collateral locked. As of January 1st 2019, it was worth around half a million USD. At the end of 2019, the total value locked in Uniswap was worth ~$28 million.
Despite their impressive growth patterns in 2019, Uniswap and Kyber still ranked below Oasis (operated by Maker) and IDEX (KYC required), two of the oldest Ethereum DEXs, in terms of annual volumes.
Despite Ethereum being the main platform for DeFi builders, “non-Ethereum” blockchain developers have also been working on DeFi applications and protocols.
3. Alternative DeFi (Alt-DeFi): heterogeneous but mostly lagging
In this section, we explore what we defined as “Alt-DeFi”: the alternative DeFi space, outside of Ethereum. Alt-DeFi applications run on a variety of blockchains such as EOS, Binance Chain, Bitcoin, Cosmos, and others.
Regarding the current state of DeFi’s Bitcoin, its main application relates to payment.
Specifically, solutions have been developed to improve the scalability of Bitcoin for small payments. The most prominent example of them is the Lightning Network, which operates as a second layer for Bitcoin.
Chart 23 – Daily Lightning Network capacity growth in BTC (left axis) and USD (right axis)

Accurate data is hard to estimate for the Lightning Network. However, its adoption likely remains feeble with its total capacity at around 854 BTC (i.e., $6.2 million) on December 31st. So far, only one significant exchange (Bitfinex) has adopted the Lightning Network for Bitcoin deposits and withdrawals.
On the other hand, EOS also displays some interest from market participants. First of all, EOSREX, the lending and borrowing platform for computing resources in the EOS ecosystem, was launched in April.
Chart 24 – Daily EOS’ REX evolution of locked amount in EOS

Sources: Binance Research, DApp Review.
Since its inception, this application has displayed significant growth in the resources being provided to the platform. However, there are significant imbalances in the demand/supply dynamics as more resources have been provided than borrowed.
In Q4, however, the total amount of EOS provided declined from a peak above 105 million EOS to 75.6 million (as of December 31st).
Furthermore, while the Kyber Network is extremely popular in Ethereum, its team has also worked on several implementations of Ethereum-based KyberSwap on other blockchains:
EOS: YoloSwap
TomoChain: TomoSwap
ETH/EOS Cross-chain: Waterloo (not implemented yet)
Similarly, the success of both MakerDAO and Compound in the Ethereum space also led to the creation of similar platforms on competing blockchains.
In the EOS ecosystem, the Equilibrium protocol works in a similar fashion as MakerDAO. DAI’s counterpart is referred to as EOSDT, and the eligible collaterals are EOS coins. However, Equilibrium’s collateralization requirement is set at 130%, slightly lower than Maker’s 150%.
Chart 25 – Evolution of EOSDT’s total collateral (denominated in EOS)

Sources: DApp Review, Binance Research.
Since its creation, it has displayed significant growth. As of December 31st 2019, its total collateral locked was estimated to be worth more than 4 million EOS. However, its total marketcap remains relatively small at around 1.8 million EOSDT.
Similarly, Acueos is an EOS implementation of the Compound protocol. Unfortunately, it is not yet widely used as Compound, as illustrated by the chart below.
Chart 26 – Acueos and Compound daily number of unique users since October 2019 (log)

Sources: DApp Review, Binance Research.
Furthermore, Cosmos also possesses a similar project (as Maker), focusing on fiat-pegged crypto-backed stablecoins: Kava. On October 23rd, Kava raised funds successfully on Binance Launchpad.
Meanwhile, NEO also has its own similar MakerDAO-like project named Alchemint, where SDUSDs are minted by collateralizing NEO. As of December 31st 2019, less than 60,00 SDUSDs were issued within the Alchemint platform.
PEG Network also launched its own MakerDAO-style collateralized debt smart contract, allowing users to print USDB against Bancor Token (BNT, available on both Ethereum and EOS chains) deposits.
Also, it is worth noting that many traditional decentralized exchanges exist on many blockchains such as Binance Chain (Binance DEX), NEO (e.g., Switcheo), EOS (e.g., NewDEX), and Tron (e.g., PoloniDEX).
Chart 27 – Daily volume on Binance DEX (in $ million) since its inception

Sources: DApp Review, Binance Research.
For instance, Binance DEX launched on March 23rd 2019. Since June 2019, its average daily volume has mostly declined. It remained over $1 million for most of the year. In total, Binance DEX displayed a total volume of $755 million in its first nine months.
Switcheo offers a decentralized exchange on NEO and Ethereum, with full interoperability across the two blockchains.
Chart 28 – Daily volume of Switcheo on NEO/Ethereum (in USD)

Sources: DApp Review, CoinGecko, Binance Research.
In 2019, Switcheo displayed a total annual volume of $49.5 million.
Other exchanges, with cross-chain interoperability, include Bancor Network (EOS/Ethereum) and other projects being developed such as Thorchain, which performed its own coins’ IDO on Binance DEX.
In addition to other blockchain interoperability DeFi applications, Loom Network has been working on bringing DeFi onto alternative, large marketcap, blockchains, such as Tron and Binance Chain.
4. The paradox of DeFi and 2020’s views
4.1 DeFi: a small but dynamic ecosystem
While DeFi represents a tiny segment of the crypto-industry, it is one of its most vibrant areas.
Chart 29 – Evolution of total daily unique users in Ethereum-based DeFi

Sources: DApp Review, Binance Research.
On average, Ethereum-based DeFi platforms displayed a number of unique daily users of 3456 users in 2019.
Chart 30 – Number of active DeFi projects (projects with more than 50 daily unique users)
Sources: DApp Review, Binance Research.
The number of active projects, defined as projects with more than 50 daily unique users, nearly doubled over 2019. However, this number remains small, in absolute numbers, as less than 20 projects are being used.
Furthermore, within the crypto-space itself, DeFi remains small. For instance, the total collateral locked in staking is much more significant, worth ~$6 billion, representing more than five times greater than the total collateral in DeFi.
Finally, the size of DeFi remains negligible compared to the (traditional) fixed income market. Recent estimations of the total debt market range are ~$250 trillion4 in 2019. In the US alone, consumer loans were estimated at ~$1.6 trillion5 in 2019.
4.2 The growth of staking
Unlike lending, staking is conducted at the protocol level where users lock funds to secure the network and subsequently earn staking rewards. This is discussed in-depth in our report about the Rise of Staking.
Chart 31 – Expected yields (%) for assets supported for staking on Binance.com

Sources: Binance Research, Binance.com.
As staking is conducted at the first layer of the blockchain, any rational coin-holder is ought to trust the staking protocol. Hence, we expect growing awareness in staking and more long-term investors to participate in on-chain governance and other activities. As of December 31st, according to StakingRewards.com, the cumulative market cap locked in staking protocols was estimated at $6 billion. This number should significantly increase in 2020 as more staking-based protocols launch their mainnets, and Ethereum switches over from PoW to PoS.
However, lending could potentially cannibalize staking, owing to the promise of higher lending rates. Yet, as of December 31st, funds locked in DeFi are estimated worth ~$670 million for Ethereum and ~$200 million for EOS (mostly from EOSREX).
We also expect consolidation toward large staking services provided by both crypto-exchanges, such as Binance (i.e., Binance Staking), Coinbase (e.g., Tezos), and KuCoin’s staking services), and dedicated providers. Will staking lead to centralization through economies of scale?
Yet, as illustrated in our recent institutional report, staking is not yet one of the critical growth drivers for the crypto-industry, according to large traders and institutional investors. Will the expected launch of the beacon-chain of Ethereum shake up the industry?
4.3 Ethereum’s DeFi
In 2020, we expect several trends regarding Ethereum-based DeFi:
The end of the Maker’s dominance: we expect Compound to take over Maker in 2020, by both volumes and locked amounts. Furthermore, Synthetix will likely also challenge Maker as it allows greater flexibility in regards to what assets Synths can be pegged to (e.g., Silver Ounce/sXAG or inverse BNB/iBNB). However, the collateral used in Synthetix remains tied to an asset (SNX) that is not liquid, which raises concerns. In comparison, all the assets eligible as collateral in Maker are very liquid (ETH and BAT).
Maker’s DSR integration: despite our expectation that MakerDAO’s dominance will likely be challenged, it will remain one of the most centerpieces in the DeFi industry. While the addition of new collateral (e.g., BAT) garnered most of the interest, the Dai Savings Rate (DSR) will likely become one of the most important rates in the DeFi space. For instance, Fulcrum has already integrated DSR’s into its platform. Exchanges, which list DAI for trading, will also continue to integrate the Dai Savings Rate onto exchanges.
The nascency of under- or even less-collateralized solutions: as discussed in our first report about DeFi, over-collateralization does not help the unbanked. New solutions are being considered, such as social fund recovery, credit scoring, zero-knowledge proofs, and credit market DAOs. We also expect further use of the time value of money relationship to allow users to borrow on the promise of future expected cash flows. Experiments with Sablier could pave the way for dedicated protocols. In early 2020, Aave (LEND) will be moving over its lending markets to mainnet, from its current testnet implementation, including its undercollateralized flash loans.
The launch of DeFi derivatives on Ethereum mainnet: Convexity Protocol and other platforms (e.g., UMA Protocol) are likely to bring new trading opportunities for the DeFi space. However, skepticism remains on how to manage risk and rewards from the perspective of the option underwriters. Furthermore, hedging solutions against DAI price risk6, like SwanDai, are also likely to be deployed on mainnet.
USD Tether (USDT): USD Tether, following the migration of a large chunk of its circulating supply to Ethereum, is likely to be integrated in the near future into some DeFi protocols in 2020. For instance, USD Tether will be included in the Compound protocol.
The growth of “one-stop” solutions: platforms like Zerion and InstaDApp aim to offer a superior user experience and make the use of DeFi easier. Specifically, these single UIs allow interaction with various platforms. Also, protocol-aggregators such as DeFiZap and Dex.ag should also get traction as they typically allow users to minimize gas fees and to hedge against platform-specific risks.
4.4 Expansion of the Alt-DeFi
Regarding the non-Ethereum DeFi space, we expect several developments from the perspective of other blockchains such as:
Bitcoin (BTC) is likely to play a more significant part of DeFi, both on Ethereum and as a stand-alone solution.
BTC as collateral: Bitcoin, the largest crypto-asset by marketcap, could potentially be added as collateral in MakerDAO (e.g., tBTC, WBTC), and further garner adoption in established Ethereum-based DeFi applications. SODA also allows borrowing of ERC-20 tokens with BTC as collateral.
BTC side-chains: DeFi on Bitcoin sidechains are also likely to draw more attention and to be investigated. Initiatives such as Money On Chain serve this purpose.
Binance Chain: owing to BEP-3, DeFi on the Binance Chain is likely to garner attention from crypto-participants. Early initiatives from Loom Network illustrate the growing appeal from third-party contributors7.
EOS: greater synergies with Ethereum (e.g., Bancor, Kyber) should occur. Furthermore, its own DeFi ecosystem is being developed, as discussed in the previous section.
NEO: NEO has SDUSD, minted in the Alchemint ecosystem, and the Switcheo exchange that operates on both ETH and NEO blockchains. We expect additional DeFi solutions to be implemented in 2020.
Cosmos: Kava is expected to go live in 2020, which could mark the birth of Cosmos’ first decentralized crypto-backed stablecoin. Kava plans to include collaterals such as XRP and BNB.
Tezos: DeFi was specifically added in September 2019 to the new RFP for ecosystem grants by the Tezos foundation.
Algorand: the Algorand foundation released in November 2019 a statement where it mentioned specifically its interest in the “DeFi movement”.
TomoChain: with the launch of TomoX and an extended TomoBridge (cross-chain swap), TomoChain could potentially see new projects being developed.
Tron: while initiatives from Loom could port over MakerDAO onto Tron, decentralized exchanges (e.g., PoloniDEX, Zethyr) are one of the largest DeFi applications on Tron.
Waves: its recent annual event focused almost entirely on DeFi applications. The announcement of Gravity Hub, a cross-chain interoperability service, could potentially bring some of DeFi onto the Waves ecosystem.
Ontology: bolstered by the addition of PAX into its network, it aims at developing DeFi use-cases on its chain, as announced in August 2019.
While the Alt-DeFi space will likely grow in 2020, it remains to be seen whether a significant number of users would be willing to use these services.
4.5 Final words
In this report, not all the platforms and protocols were discussed, as the scope of this industry is too broad to analyze in a single report. For instance, asset management platforms (e.g., Set Protocol and Melon) and relayers (e.g., Loopring) were not included in the discussion.
In our views, we expect DeFi to further garner interest from industry participants. However, use-cases have,
so far, remained mostly confined within the existing crypto-community.
Furthermore, this report added decentralized exchange applications as part of DeFi, but the scope of DEXs typically expands beyond the unique world of DeFi.
Once some technical and legal challenges are solved, we expect a meteoric growth in the decentralized financial industry, likely to attract individuals and capital beyond the scope of the existing crypto-industry.
To conclude, the rapid development of DeFi has already led to the creation of an active and creative global community, building the first blocks to challenge traditional financial platforms.
Is the world ready for the borderless state of DeFi?
On the other hand, Tron and EOS DApps are mostly related to gambling and gaming activities, with the majority of their on-chain DApp volumes accounting for services such as casino-like services, etc.↩
The sum of the two is less than the figures in chart 2 as users can rank in both categories.↩
While some NFT exchanges were included, their contribution to total volume is negligible (less than 1%).↩
It also adds corporate and government debt. https://www.bloomberg.com/news/articles/2019-01-15/global-debt-of-244-trillion-nears-record-despite-faster-growth↩
Prediction markets like Augur can also serve this purpose.↩
Binance X is working with third-party developers to push for Binance Chain’s applications. https://binancex.dev/↩


 Source: Binance Research