Arsip Tag: prediksi bitcoin

Bitcoin Bullish Today English

Bicoin Prediction Today
Daily Bitcoin Predictions . AMsadad.Com. Greetings, hopefully there will be no profits left behind today, friends in the @trader_ITC group, because today bitcoin is rising wildly as we talked about yesterday.
Stay in the Bitcoin area Bullish Comeback finally today also entered at 1d resistance at the price of 9388 USD – 9420 USD.
And this adds to my belief in the previous prediction that Bitcoin Towards Golden Cross on 31 January was previously predicted.
If anyone hasn’t read, please read right away and for today I will discuss the next bitcoin resistance.
Bitcoin Chart 1D
On the 1d bitcoin chart it is still very good for investors to immediately go in and hold up to profit, yes right up to profit therefore if bitcoin correction don’t rush to sell,

Is it possible correction …
Later I will answer on the chart with a smaller TimFrame, and for the 1d bitcoin chart I still say Bitcoin Bullish Comeback .

Please pay attention to the smaller Bitcoin Chart because for the accuracy of our predictions it is advisable to be wise in all TFcharts.
Bitcoin Chart 4h
If you see above what is your opinion creepy?
So with this I can confirm the answer is maybe bitcoin will experience a quick correction, because TF 4h is already high.
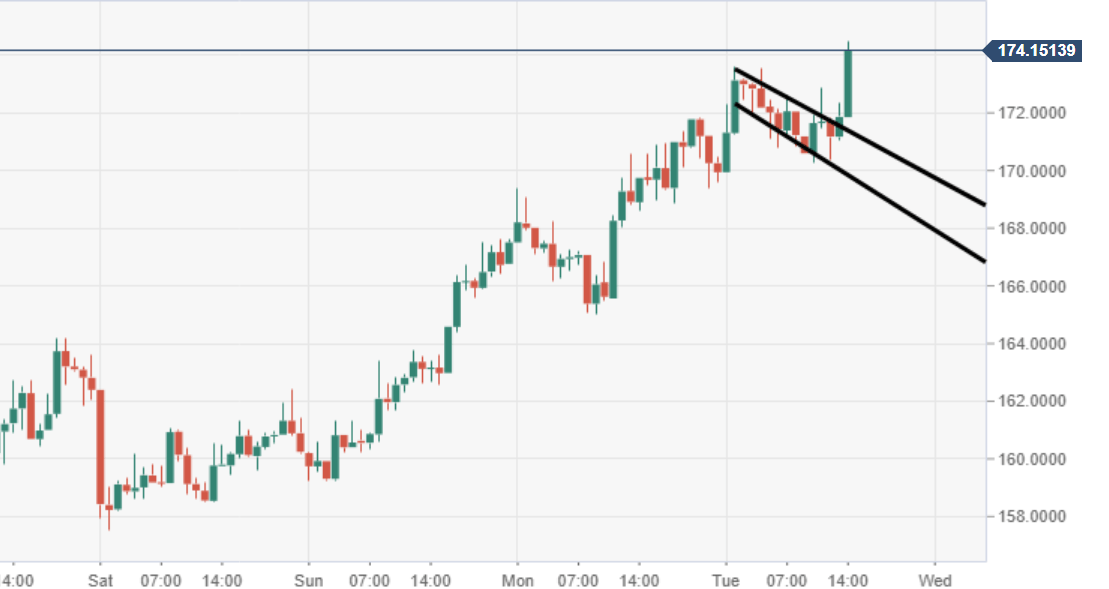
Yes indeed the TF4h Bitcoin Chart is already high in terms of trends and rsi, there is also a point if if bitcoin gets corrected quickly, however

Bitcoin might be able to fight the current Tf 4h with the proposition of a 1h TF trend that is still pressing the Bullish area.

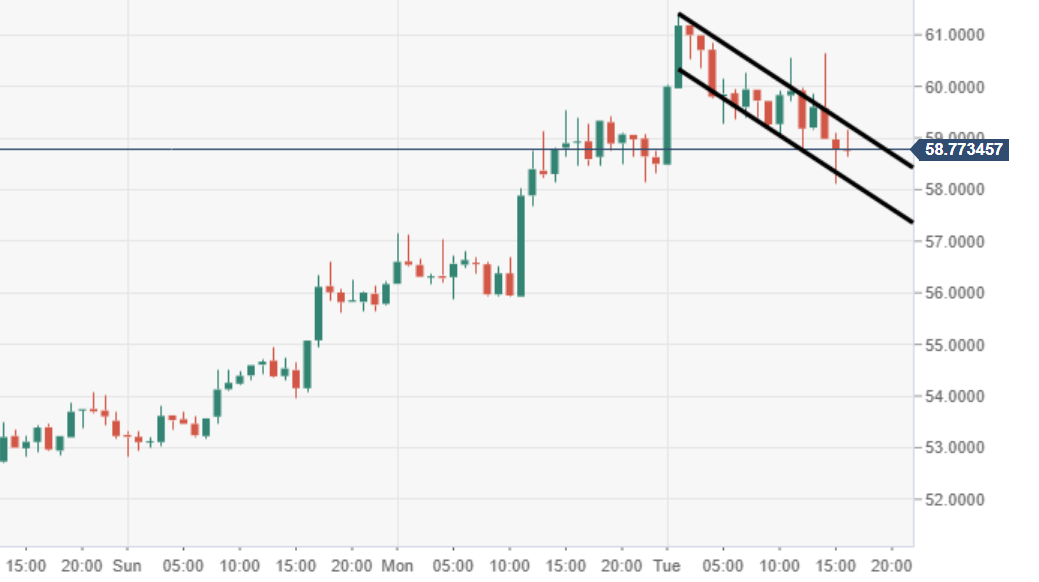
Of course I totally agree if the 1h bitcoin chart is against the 4h bitcoin chart, because from yesterday actually the bitcoin chart 4h requested correction,
But because the demands of smaller charts like 30m and 1h are demanding to go up, well inevitably have to go up.
The condition if we want our prediction 87% to be close to Real is to be able to be wise in comparing tifme bitcoin frame decisions,
Bitcoin Chart 1h
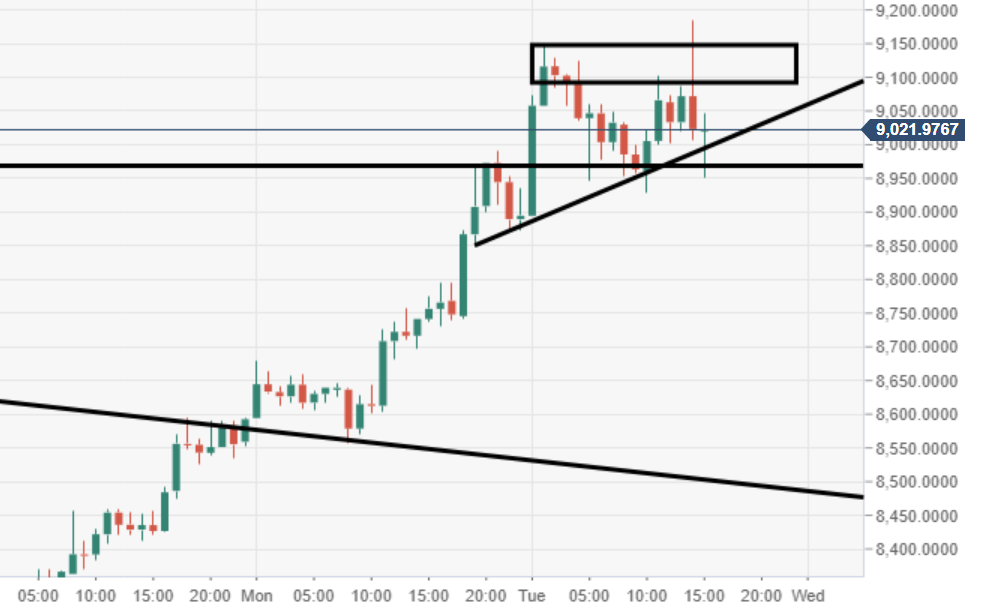
Above is a picture of the 1h Bitcoin chart which I have referred to earlier with urgent demands for a 4h bitcoin chart.

But do not rule out if tf 1h also suddenly corrected,
Because as I often say “crypto patterns will repeat with the word correction”.

and I’m also sure that bitcoin will be strong at the 1D level today in the area of ​​9522 USD – 9899 USD
CONCLUSION S&R
  • Prediction of 1H Bitcoin support area 9150 – 9200 usd and resistance 9522 – 9720 USD
  • Prediction of 4H Bitcoin support area 9150 – 9200 usd and resistance 9522 – 9860
  • Predictions of 1D Bitcoin support area 9000 – 9150 usd and resistance of 10,000 USD

Bitcoin Bullish Comeback sub Indonesia

Prediksi Bitcoin Harian. AMsadad.Com. Salam profit semoga tidak ada yang ketinggalan profit hari ini teman-teman di group @trader_ITC, Karena hari ini bitcoin naik dengan buas seperti yang kita bicarakan kemarin.
Tetap di area Bitcoin Bullish Comeback akhirnya hari ini masuk juga di resistance 1d dengan harga 9388 USD – 9420 USD .
Dan ini menambah keyakinan saya di prediksi sebelumnya yaitu Bitcoin Menuju Golden Cross tanggal 31 januari sebelumnya sudah di prediksi.
Jika ada yang belum membaca silakan segera membaca dan untuk hari ini saya akan bahas mengenai resistance bitcoin berikutnya.
Bitcoin Chart 1D

Di chart bitcoin 1d masih sangat bagus untuk investor segera masuk dan hold sampai profit, iya benar sampai profit karena itu jika bitcoin koreksi jangan di buru-buru menjual,
Mbah apa mungkin koreksi ,,,???
Nanti saya jawab di chart dengan TimFrame yang lebih kecil, dan untuk bitcoin chart 1d saya tetap bilang Bitcoin Bullish Comeback.
Silakan perhatikan Chart Bitcoin yang lebih kecil karena untuk ketepatan prediksi kita maka sangat di anjurkan bijaksana dalam semua TFchart.
Bitcoin Chart 4h

Jika kalian lihat di atas menyeramkan apa pendapat kalian ?
Maka dengan ini saya bisa pastikan jawabanya adalah mungkin saja bitcoin akan mengalami koreksi cepat , karena TF 4h sudah tinggi.
Iya memang Chart Bitcoin TF4h sudah tinggi dari segi trend juga rsi, ada benarnya juga jika jika bitcoin akan koreksi cepat , Namun
Bitcoin mungkin bisa melawan Tf 4h nya yang sekarang dengan dalil adanya trend TF 1h yang masih mendesak area Bullish.
Tentu saja saya sangat setuju jika chart bitcoin 1h melawan chart bitcoin 4h , karena sudah dari kemarin sebenarnya bitcoin chart 4h mintak koreksi,
Namun karena tuntutan dari chart yang lebih kecil seperti 30m dan 1h menuntut naik , yaa mau tidak mau harus naik.
Syarat jika ingin prediksi kita 87% mendekati Real yaitu harus bisa bijaksana dalam membandingkan keputusan tifme frame bitcoin,
Bitcoin Chart 1h

Di atas adalah gambar Bitcoin chart 1h yang dari tadi saya sebut dengan tuntutan mendesak bitcoin chart 4h.
Namun tidak menutup kemungkinan jika tf 1h juga tiba-tiba mengalami koreksi,
Karena seperti yang sering saya ucapkan “pola crypto akan brulang dengan kata koreksi”.
dan saya pun yakin bahwa bitcoin akan kuat di level 1D hari ini di area 9522 USD – 9899 USD hehehe nangung ya mbah, yaudah 10k deh wkwkwk
KESIMPULAN S&R
  • Prediksi Bitcoin 1H support area 9150 – 9200 usd dan resistance 9522 – 9720 USD
  • Prediksi Bitcoin 4H support area 9150 – 9200 usd dan resistance 9522 – 9860
  • Prediksi Bitcoin 1D support area 9000 – 9150 usd dan resistance 10,000 USD

These three cryptocurrencies could serve as a hedge against Bitcoin

These three cryptocurrencies could serve as a hedge against Bitcoin

Disclaimer: This article contains technical analysis, which is a methodology for forecasting the direction of prices through
the study of past market data, primarily price and volume. The content presented in this article is the opinion of the author.
None of the information you read on CryptoSlate should be taken as investment advice. Buying and trading cryptocurrencies should be
considered a high-risk activity. Please do your own diligence and consult with a financial advisor before making any investment decisions.
The cryptocurrency market tends to move in one direction,
which is mostly defined by Bitcoin’s price action. However,
a recent report shows that several cryptos have proved to be highly uncorrelated.
This feature makes them ideal to use as a hedge against the rest of the market.
The most uncorrelated assets
Investopedia defines the term correlation as a statistic that measures the degree t
o which two assets move in relation to each other. This gauge can be implemented in portfolio management and is computed as a value that must fall
between -1.0 and +1.0.
Assets with a correlation above 0.5 have a strong positive linear relationship.
Conversely, assets with a correlation below -0.5 are considered to have a
strong negative association,
which indicates that they move in opposite direction to the rest of the market.
If the correlation coefficient is 0,
this implies that there is no observable linear relationship between the two assets.
According to a recent Binance report,
the lowest correlated assets in the cryptocurrency market are Cosmos (ATOM), Chainlink (LINK), and Tezos (XTZ).
Throughout 2019, these cryptocurrencies displayed a correlation coefficient of 0.31, 0.32, and 0.40, respectively. But, there are other factors to consider, as the report reads:
“One differentiating factor between Cosmos and the other large-cap cryptoassets is the listing time – Cosmos only got launched and listed during the end of Q1 2019. As the median correlation of ATOMs appears to be increasing – annual corr. coeff. of 0.31 for 2019 with a coefficient of 0.56 for Q4 2019 -, the lower listing time might be one factor to explain this phenomenon.”
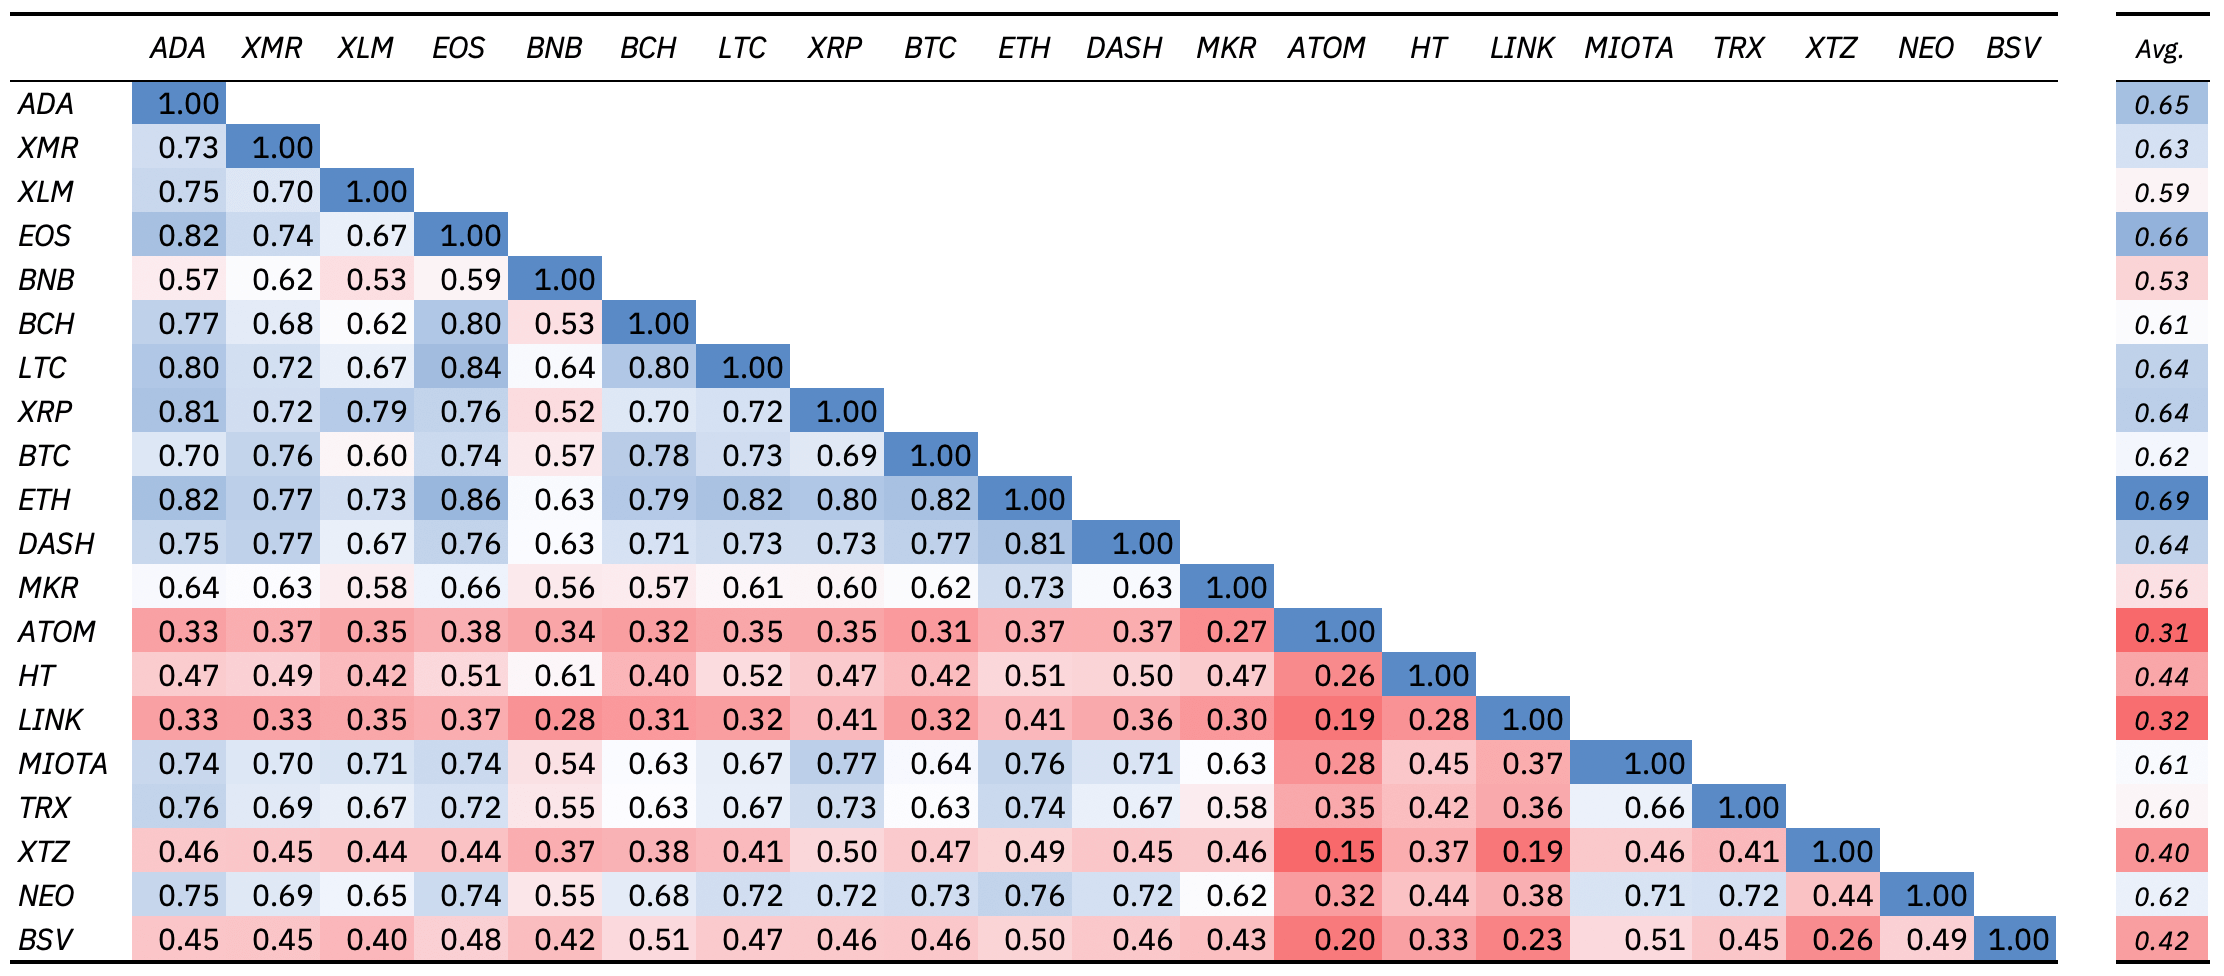
Source: Binance Research
The fact that these three cryptocurrencies moved opposite to Bitcoin during 2019 makes them useful as a hedge against it. Under this premise, analyzing their price behavior could provide some insights on where the pioneer crypto is heading next.
Cosmos (ATOM)
Cosmos is contained within a parallel channel since Jan. 19. Since then, every time this cryptocurrency plunges to the bottom of the channel, it bounces off to the middle or the top. But, when it surges to the top of the channel, it pulls back to the middle or the bottom.
Due to the inability to determine whether ATOM could breakout to the downside or to the upside, the trading range between $4.38 and $4.68 is a reasonable no-trade zone. Closing below or above this area will define the direction of the trend.ATOM/USD by TradingView
An increase in the amount of sell orders behind Cosmos could push it to break the support level. Moving below this significant price hurdle, could send this cryptocurrency down to the 38.2 percent Fibonacci retracement level that sits at $4.05.
Conversely, a spike in demand for ATOM that allows it to breakout of the current consolidation period could take it to retest the recent high of $5.38.
ATOM/USD by TradingView
Chainlink (LINK)
Like Cosmos, Chainlink’s price action is also contained in a no-trade zone since trading within this area poses a high level of risk. In fact, LINK has been consolidating between the 50 and 61.8 percent Fibonacci retracement levels since Jan. 27. These levels sit at $2.60 and $2.66, respectively.
Closing below the 50 percent Fibonacci retracement level could push Chainlink to the next level of support that sits at $2.54. However, a move above the 61.8 percent Fibonacci retracement level could allow it to surge to $2.76 or higher.
LINK/USD by TradingView
Tezos (XTZ)
On Jan. 28, Tezos went from trading at a high of $1.57 to a low of $1.51. The sudden 3.55 percent nosedive created a bearish engulfing candlestick on XTZ’s 4-hour chart. This technical pattern is considered a bearish formation that is likely to reverse the bullish trend seen over the last few days. The bearish outlook will be confirmed once the succeeding candlestick closes below the engulfing one.XTZ/USD by TradingView
An increase in the downward pressure around the current price levels could take XTZ to breakout of an ascending parallel channel where it has been trading since Jan. 25. Such a bearish impulse would likely trigger a steep correction.
Nonetheless, the ascending parallel channel could continue to hold. If so, then Tezos could bounce off the lower boundary of the channel to the middle or the upper boundary.
XTZ/USD by TradingView
Factors to consider
While Cosmos, Chainlink, and Tezos are contained within a consolidation period, Bitcoin recently failed to break above the $9,000 resistance level once again. Now, the pioneer cryptocurrency appears to be bound for a retracement.
The TD sequential indicator presented a sell signal in the form of a green nine candlestick on BTC’s 6-hour chart. This technical index estimates a one to four candlesticks correction or the beginning of a new downward countdown. A red two candlestick trading below a preceding red one candle could confirm the bearish outlook.
Additionally, an evening doji star candlestick pattern appears to be developing within the same time frame. This is a bearish reversal formation that occurs at the top of an uptrend.
Evening doji stars are composed of three candlesticks: a long green candle, a short candle, and a red candle. The combination of these three candlesticks indicates that BTC is losing its bullish momentum and could enter a corrective period.
BTC/USD by TradingView
Assuming that Cosmos, Chainlink, and Tezos are the most uncorrelated assets to Bitcoin, one could argue that if the flagship cryptocurrency retraces then these three cryptos could surge. If this is the case, such a dissociation would be important to have in mind when building a crypto portfolio.

Bitcoin, Ethereum & Litecoin – American Wrap: 1/28/2020

Bitcoin Price Analysis: BTC/USD bulls set to make a critical break above last week’s high

Bitcoin price is trading in positive territory, up +1.40% in the second half of the session. 
BTC/USD bulls are firmly back into control following a break north of $8500 again.
A big boost for the bulls as the $9000 price mark is reclaimed. 

Stocks To Watch Daily

What if you didn’t have to hunt around the internet looking for trade ideas every day? What if top researchers, analysts, and news correspondents did all the research for you? What if you could get all of that research in the easiest possible format every morning before the market opens? That’s exactly what you get when you subscribe to Benzinga Stocks To Watch. Click here to subscribe.

Ethereum Price Analysis: ETH/USD heading for a critical retest of last week’s high area

Ethereum price is trading in the green by 2.50% in the session on Tuesday. 
ETH/USD has been rallying for three straight days, as the bulls resume control, following a cooling period. 
The price must break above last week’s high area current resistance, for greater upside pressure. 

Litecoin Price Analysis: LTC/USD bulls have room to run higher following flag breakout

Litecoin price is trading in positive territory by 1% in the session on Tuesday. 
LTC/USD extends to the north, three straight days in the green, following flag breach. 
Supply can be observed around the $62-64 price range. 
Posted-In: Cryptocurrency News Emerging Market ETFs Currency ETFs Forex Global Markets ETFs